Abstract
Despite advances in diagnosis and therapy, atherosclerotic cardiovascular disease remains the leading cause of morbidity and mortality in the Western world. Predicting metabolically active atherosclerotic lesions has remained an unmet clinical need. We hereby developed an electrochemical strategy to characterize the inflammatory states of high-risk atherosclerotic plaques. Using the concentric bipolar microelectrodes, we sought to demonstrate distinct Electrochemical Impedance Spectroscopic (EIS) measurements for unstable atherosclerotic plaques that harbored active lipids and inflammatory cells. Using equivalent circuits to simulate vessel impedance at the electrode-endoluminal tissue interface, we demonstrated specific electric elements to model working and counter electrode interfaces as well as the tissue impedance. Using explants of human coronary, carotid, and femoral arteries at various Stary stages of atherosclerotic lesions (n = 15), we performed endoluminal EIS measurements (n = 147) and validated with histology and immunohistochemistry. We computed the vascular tissue resistance using the equivalent circuit model and normalized the resistance to the lesion-free regions. Tissue resistance was significantly elevated in the oxLDL-rich thin-cap atheromas (1.57±0.40, n = 14, p < 0.001) and fatty streaks (1.36±0.28, n = 33, p < 0.001) as compared with lesion-free region (1.00±0.18, n = 82) or oxLDL-absent fibrous atheromas (0.86±0.30, n = 12). Tissue resistance was also elevated in the calcified core of fibrous atheroma (2.37±0.60, n = 6, p < 0.001). Despite presence of fibrous structures, tissue resistance between ox-LDL-absent fibroatheroma and the lesion-free regions was statistically insignificant (0.86±0.30, n = 12, p > 0.05). Hence, we demonstrate that the application of EIS strategy was sensitive to detect fibrous cap oxLDL-rich lesions and specific to distinguish oxLDL-absent fibroatheroma.
Keywords: Inflammatory atherosclerotic plaque, Electrochemical Impedance Spectroscopy, Concentric bipolar microelectrodes, oxLDL, Fibrous atheroma, Calcification
1. Introduction
Detection of atherosclerotic lesions prone to rupture is of utmost importance in the management of patients with acute coronary syndromes or stroke (Anderson et al. 2007; Ross 1999). Despite the advent of computed tomographic (CT) angiography, high resolution MRI (Worthley et al. 2003), intravascular ultrasound (IVUS), near-infrared fluorescence (NIRF) (Jaffer et al. 2008), time-resolved laser-induced fluorescence spectroscopy (Marcu et al. 2001) and other techniques, predicting metabolically active atherosclerotic lesions has remained an unmet clinical need.
Mechanically unstable atherosclerotic plaque is often characterized by a thin-cap fibrous atheroma (< 65 µm) and a metabolically active lipid core (Finn et al. 2010; Vengrenyuk et al. 2006). Rupture of these plaques is clinically manifested as acute coronary syndromes or stroke (Ambrose et al. 1988; Fuster et al. 1992; Little et al. 1988). Emerging imaging modalities such as an integrated intravascular ultrasound (IVUS) and optical coherence tomography (OCT) system have enabled the colocalization of thin-cap fibroatheroma with intimal hyperplasia and calcification (Li et al. 2010; Sanz and Fayad 2008). However, assessing metabolic states in the inflammatory, albeit non-obtrusive, lesions has remained a diagnostic challenge.
Atherosclerotic lesions can display distinct electrochemical properties (Streitner et al. 2009; Suselbeck et al. 2005). Biological tissues store charges, and electric impedance (Z) develops as a function of frequency in response to the applied alternating current (AC). Active lipids and macrophages cause distinct electrochemical properties in the vessel wall that can be measured by electrochemical impedance spectroscopy (EIS). Catheter-based linear 4-point microelectrodes were reported to measure frequency-dependent tissue impedance in New Zealand White (NZW) rabbits (Konings et al. 1997a; Streitner et al. 2009; Suselbeck et al. 2005). To provide reliable endoluminal EIS measurements, we applied the concentric bipolar microelectrodes to address non-homogeneous tissue composition, uneven endoluminal topography, and non-uniform current distribution in explants of rabbit arteries, and demonstrated elevated impedance spectrum in the pre-atherosclerotic tissues (Yu et al. 2011). These lesions with oxidized Low Density Lipoprotein (oxLDL) and foam cell infiltrates were considered clinically silent, and were previously reported to have no significantly different impedance compared with the healthy aorta (Suselbeck et al. 2005). However, the application of concentric bipolar electrodes detected changes in electrochemical impedance signals in the pre-atherosclerotic lesions (Yu et al. 2011).
Here, we demonstrate a sensitive and specific approach to characterize metabolically active lesions via EIS measurements in explants of human aorta. We developed equivalent circuit models to assess electric circuit parameters in the context of simulating endoluminal EIS measurements. EIS measurements performed on 15 coronary, carotid, and femoral arteries at various Stary stages of atherosclerotic lesions revealed distinct EIS signals (Stary 2000; Stary et al. 1995). Endoluminal impedance was significantly higher in the active lipid-rich lesions as validated by positive anti-oxLDL staining. To corroborate the specificity of EIS measurements, we demonstrate significant differences in frequency-dependent impedance signals among fatty streaks (Stary Type II lesions), thin fibrous cap oxLDL-rich (Type III or IV), oxLDL absent fibroatheroma (Type V), and calcified lesions (type VII). Hence, we provide new electrochemical insights into the applications of EIS measurements to detect active metabolic conditions in the mechanically unstable atherosclerotic lesions.
2. Material and Methods
2.1 Electrochemical Impedance Spectroscopic Measurements
Fresh-frozen human artery specimens were obtained from National Disease Research Interchange (NDRI) in accordance with the University of Southern California Institutional Review Board guideline. A total of 15 human coronary, carotid and femoral arterial segments from 9 donors were analyzed for endoluminal EIS measurements. The arterial samples were immersed in phosphate buffered saline (PBS) solution (Invitrogen, CA, USA), and sectioned longitudinally to unfold the endoluminal sides. The gross pathology of individual specimens revealed various degrees of atherosclerosis as classified by Stary stages from type I to VII (Stary 2000; Stary et al. 1995) (Supplementary Table 1). A total of 147 points of interest with gross lesion-free condition or various types of atherosclerotic lesions were selected for endoluminal EIS measurements.
EIS measurements were conducted using the concentric bipolar microelectrodes with a flat-tip profile (FHC Co., ME, USA) as previously described (Yu et al. 2011). Briefly, the concentric bipolar microelectrode was mounted vertically on a micro-manipulator (World Precision Instruments, FL, USA), and made in contact with tested tissue at selected measuring point. An Ag/AgCl electrode (World Precision Instruments, FL, USA) was used as the reference electrode. Frequency-dependent impedance was measured from 100Hz to 300kHz (Gamry Series G 300 potentiostat, PA, USA). The magnitudes and phases of the EIS measurements were recorded at 20 data points per frequency decade, and the measured impedance spectrums were analyzed (Gamry Echem Analyst software, PA).
2.2 Equivalent circuit model and simulation
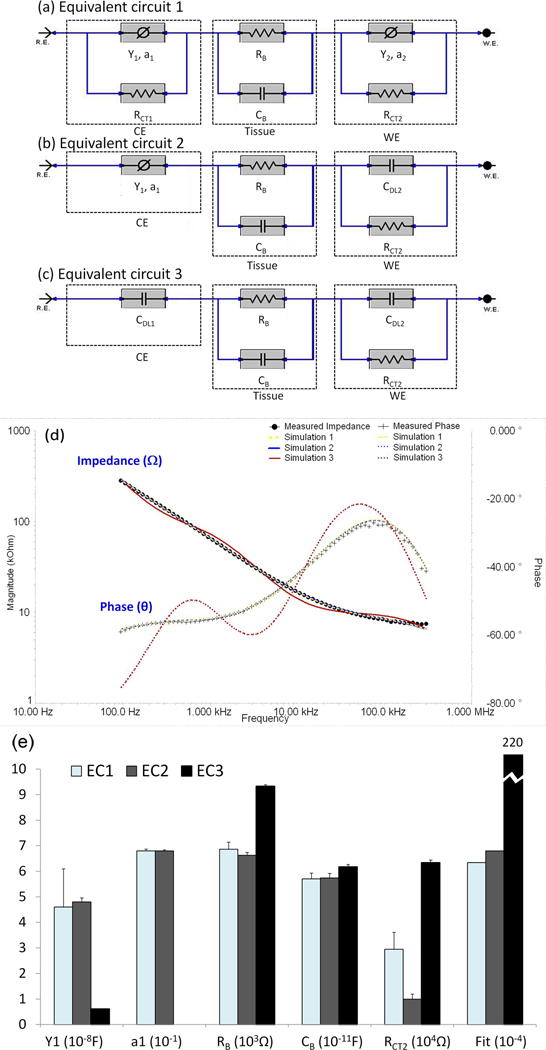
To simulate equivalent circuit model for the concentric bipolar electrode-endoluminal tissue interface, we constructed three models describing both working and counter electrode interface as well as the tissue impedance. Equivalent Circuit model 1 (EC1) was comprised of 6 electric elements (Fig. 1a). Both counter electrode (CE) and working electrode (WE) were denoted as a constant phase elements in parallel with a charge transfer resistance. The impedance of constant phase element ZCPE can be expressed as:
| (1) |
where ‘Y’ represents the capacitance and ‘a’ is the empirical constant describing the surface property of electrode. When a = 1, the CPE operates as an ideal capacitor. In most of the cases, a falls between 0 and 1 (0 < a <1), and ZCPE indicates the non-ideal behavior of electrode-tissue interface capacitance. The charge transfer resistance, RCT, is predominantly dependent on the chemical and physical properties of electrolyte solution and electrode material. Blood vessel is considered to harbor both resistive (RB) and capacitive (CB) properties; thus, both contribute to the overall tissue impedance. The RB and CB values were mainly dependent on the composition and structure of the tissue, particularly its water, lipid, ion and charged molecule content. With the assumption of an extremely large charge transfer resistance (RCT1) at large-area counter electrode and an ideal double layer capacitance (CDL2) replacing the CPE at working electrode, we implemented Equivalent Circuit model 2 (EC2) to avoid potential over-fitting to simplify the simulation (Fig. 1b). In this context, the total number of parameters was reduced to 6. In addition, by assuming that CPE at counter electrode also acts as an ideal double layer capacitance (CDL1), Equivalent Circuit model 3 (EC3) further reduced total parameters to 5 (Fig. 1c).
Figure 1. Equivalent circuit models to simulate electrochemical impedance spectrum measured between the concentric bipolar electrodes.
(a) Equivalent Circuit 1 (EC1) encompassed electric circuit parameters for working and counter electrodes interface as well as arterial wall impedance. The electrode-endoluminal interface was modeled by a constant phase element (CPE) having an impedance in parallel with a charge transfer resistance (RCT). The vessel wall harbors both resistive (RB) and capacitive properties (CB). Hence, a total of 8 electric circuit parameters were included. CE: Counter electrode; WE: working electrode. (b) Equivalent Circuit 2 (EC2) was a simplified version of EC1. By assuming a very large charge transfer resistance at the counter electrode interface, RCT1 was removed. CPE in the working electrode was replaced with a double layer capacitor (CDL2). The total number of electric circuit components was reduced to 6. (c) Equivalent Circuit 3 (EC3) was a further simplified version of EC2. By assuming that CPE in the counter electrode also acted as an ideal double layer capacitor (CDL1), the total number of parameters was reduced to 5. (d) Both EC1 and EC2 simulated experimental EIS measurements accompanied by approximately 2.5% error, whereas EC3 was accompanied by 14.8% error and a deviated phase (θ) values from the endoluminal EIS signals. (e) Selected circuit parameter values for endoluminal EIS data shown in Fig. 1d. The values were derived from simulations using EC1, EC2 and EC3, respectively. Y1, a1, RB and CB values derived from EC1 and EC2 were almost identical. The best fit EC1 and EC2 models had comparable Goodness of Fit (6.34E-4 and 6.8E-4, respectively), whereas the best fit EC3 model had significantly higher Goodness of Fit (2.2E-2), indicating larger deviation from experimental data.
The best-fitting model parameters (RB, CB, Y, a, RCT and CDL) for the 3 equivalent circuits were simulated, using a simplex algorithm in the Gamry Echem Analyst software. The difference between the simulated and experimental impedance was represented as a single “Goodness of Fit” value, equivalent to the square of the overall percentage error. Using this approach, we were able to compare the agreement between the simulated and experimental spectra, and to verify the equivalent circuits as the best suited model for concentric bipolar endoluminal EIS applications.
2.3 Histology and Immunohistochemistry
Human specimens were sectioned and immersed in 4% paraformaldehyde for paraffin fixation immediately following the impedance measurements. Multiple slides with thickness of 5µm were cut for histological evaluation. Standard hematoxylin and eosin (H&E) staining was performed to visualize initima, media, smooth muscle cells, adventitia, and foam cells. The metabolic states of atherosclerotic lesions were assessed by anti-oxLDL antibody (mAb4E6) to active lipids, Oil-red-O to lipid content, and von Kossa to calcification. All histological sections were visualized under Olympus IX70 microscopes (Olympus, Japan) and captured with a CCD digital camera (ProGres® C3, Jenoptic, Germany). Metabolically active conditions of the fibroatheromas were classified by the Stary stages in terms of intimal hyperplasia, thin-cap atheroma, active lipids, and calcification (Stary 2000; Stary et al. 1995).
2.4 Statistical analysis
Atherosclerotic lesions were categorized into five types (lesion free/fatty streak/thin cap oxLDL-rich atheroma/ oxLDL-absent fibroatheroma/calcified lesions) based on histological evidence. Due to variations in specimen size, thickness, and possible changes in electrode surface chemistry after multiple applications, inter-specimen variations in baseline EIS measurements could develop. To standardize comparisons, we normalized all of the parameter values obtained from simulation to the respective mean parameter values obtained from the lesion-free sites of the same specimens. Next, one-way analysis of variance (ANOVA) and two-tailed T-test were used for multi-group comparison and comparison between lesion and lesion-free groups, respectively. P values < 0.05 were considered statistically significant.
3. Results
3.1 An optimal equivalent circuits to simulate endoluminal EIS measurements
Both Equivalent Circuits 1 and 2 (EC1 and EC2) predicted frequency-dependent changes in impedance (^) and phase (and were in agreement with the endoluminal EIS measurements in the human carotid arteries accompanied by approximately 2.5% error (Fig. 1d). Equivalent Circuit 3 (EC3) predicted frequency-dependent changes in impedance accompanied by approximately 14.8% error and by a significant deviation in the phase values (θ). We further compared the individual circuit parameters among the three equivalent circuits (Fig. 1e and Supplementary Table 2), and revealed that RB, CB and Goodness of Fit values were nearly identical between equivalent circuits 1 and 2. Given that the estimated value of charge transfer resistance (RCT1) in the counter electrode of EC1 exceeded the computational limit (1038Ω) of the software (Gamry Echem Analyst), we were able to remove the high RCT1 from EC2. However, the assumption that CPE in the counter electrode functioned as a double layer capacitor (CDL1) resulted in a decrease in Goodness of Fit and a deviation in phase (θ) values in EC3. In this context, EC2 provided the optimal model to simulate EIS results in the concentric bipolar electrode-endoluminal tissue interface, and established the basis for the ensuing analysis of endoluminal EIS measurements.
3.2 Endoluminal EIS measurements in the fatty streaks
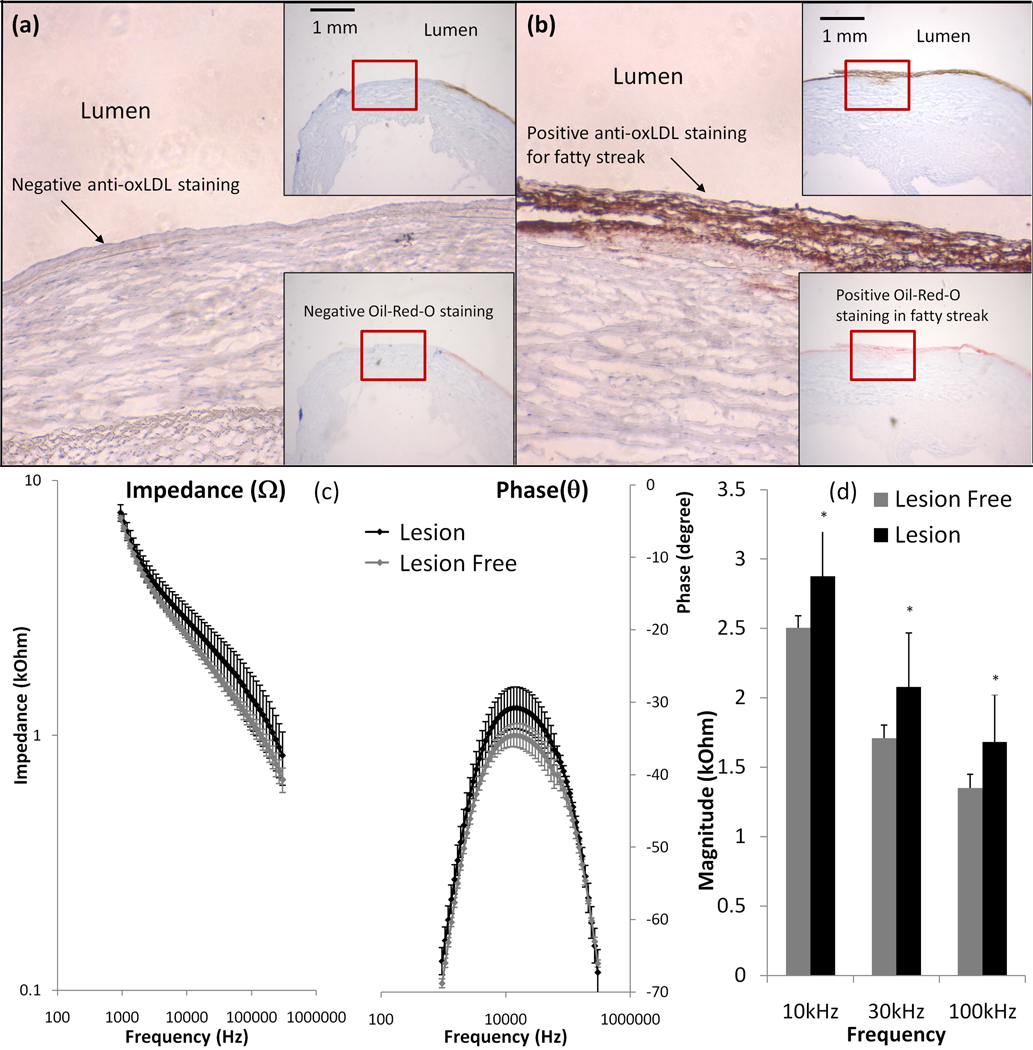
Endoluminal EIS measurements were compared between fatty streak-rich and fatty streak-absent sites, followed by immunohistochemistry analysis for anti-oxLDL and Oil-red-O staining. The fatty streak-absent site was stained negative for anti-oxLDL (Fig. 2a). Adjacent to this site was the fatty streak–rich site that was stained positive for both anti-oxLDL and Oil-Red-O (Fig. 2b). The EIS signals revealed the frequency-dependent differences between fatty streak-rich and fatty streak-free sites from 10 kHz to 300 kHz. The maximum difference in phase between the two measurements was at ~10 kHz (Fig. 2c). Impedance of the fatty streak-rich sites appeared to have greater variance (Fig. 2c), possibly due to the fact that early fatty streaks varies greatly in size and thickness. Despite of the higher standard deviation for fatty streak sites, statistical analysis showed that the impedance of fatty streak sites were significantly elevated from 10 kHz to 100 kHz (p < 0.01, n = 10 for fatty streak-rich, and n = 8 for fatty streak-free endoluminal surface) (Fig. 2d). Hence, we demonstrate a significant frequency-dependent increase in impedance in the fatty streaks (Stary Type II lesions) compared to lesion-free sites.
Figure 2. Endoluminal EIS measurements of fatty streaks.
(a) Anti-oxLDL staining was negative in the fatty streaks-free region. The right upper insert showed the luminal wall and right lower insert showed the corresponding negative Oil-red-O staining. (b) Both anti-oxLDL and Oil-Red-O were positive in the fatty streaks. (c) Endoluminal tissue impedance increased from 10 kHz to 300 kHz in the presence of fatty streaks. The maximum phase difference between lesion-free and fatty streak regions developed at ~10 kHz. Impedance measured from fatty streak sites appeared to have greater variance. (d) Statistically significant difference in impedance of lesion-free sites and fatty streak sites was observed from 10 kHz to 100 kHz (p <0.01, n = 10 for fatty streaks and n=8 for lesion-free).
3.3 Sensitive endoluminal EIS measurements in the thin-cap atheromas
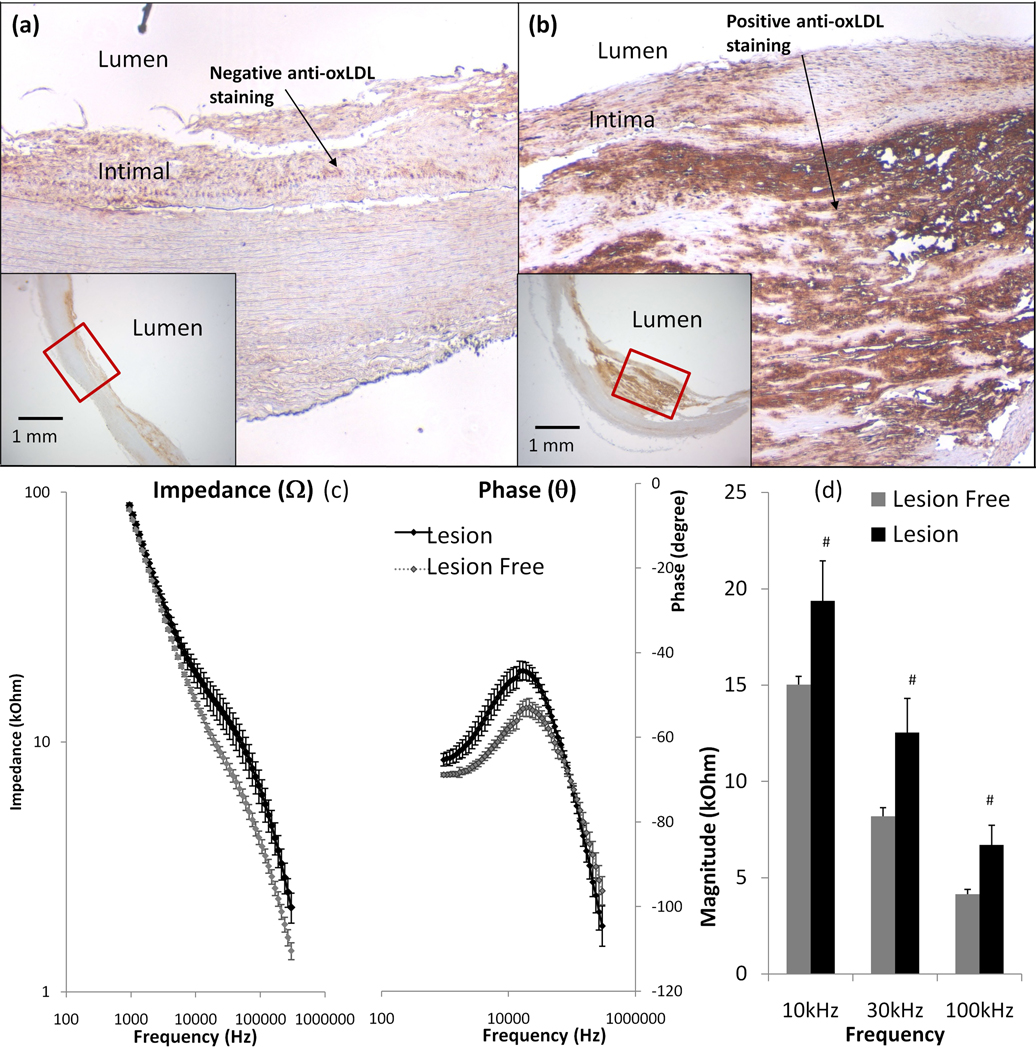
To address the inflammatory states underneath the fibrous caps, we demonstrate the application of EIS in en face human carotid arteries. Endoluminal EIS measurements were compared between intimal hyperplasia and early stage atheroma. Immunohistochemistry revealed a negative anti-oxLDL staining in region of intimal hyperplasia (Fig. 3a), but positive anti-oxLDL staining in the thin-capped (50 to 150 µm in cap thickness) atheroma that harbored a lipid core (Fig. 3b). Endoluminal EIS measurements revealed an increase in impedance from 10 kHz to 300 kHz in the thin-cap atheroma (Fig. 3c). The maximal phase differences between lesion-free and atheroma regions was also at 10 kHz. The bar graph further provided statistically significant differences in impedance ranging from 10 kHz to 100 kHz (p < 0.01, n = 6 for both thin-cap atheroma and lesion-free) (Fig. 3d). Thus, we demonstrate a significant frequency-dependent increase in impedance in the oxLDL-rich atheroma (Type III or IV) compared to the oxLDL-absent lesion-free regions.
Figure 3. Endoluminal EIS measurements of oxLDL-rich fibrous atheroma.
(a) Despite the presence of intimal hyperplasia, anti-oxLDL staining was negative. The left lower insert showed endoluminal intimal hyperplasia. (b) Anti-oxLDL staining was positive, and the fibrous cap thickness ranged from 50 to 150µm. The right lower insert showed the intra-plaque atheroma. (c) Endoluminal tissue impedance increased from 10 kHz to 300 kHz in the presence of the anti-oxLDL-positive fibrous atheroma. The maximum phase difference between lesion-free and atheroma sites also developed at ~10 kHz. (d) Maximum difference in impedance was observed from 10 kHz to 100 kHz (p <0.01, n = 6 for both atheroma and lesion-free sites).
3.4 Specificity of endoluminal EIS measurements
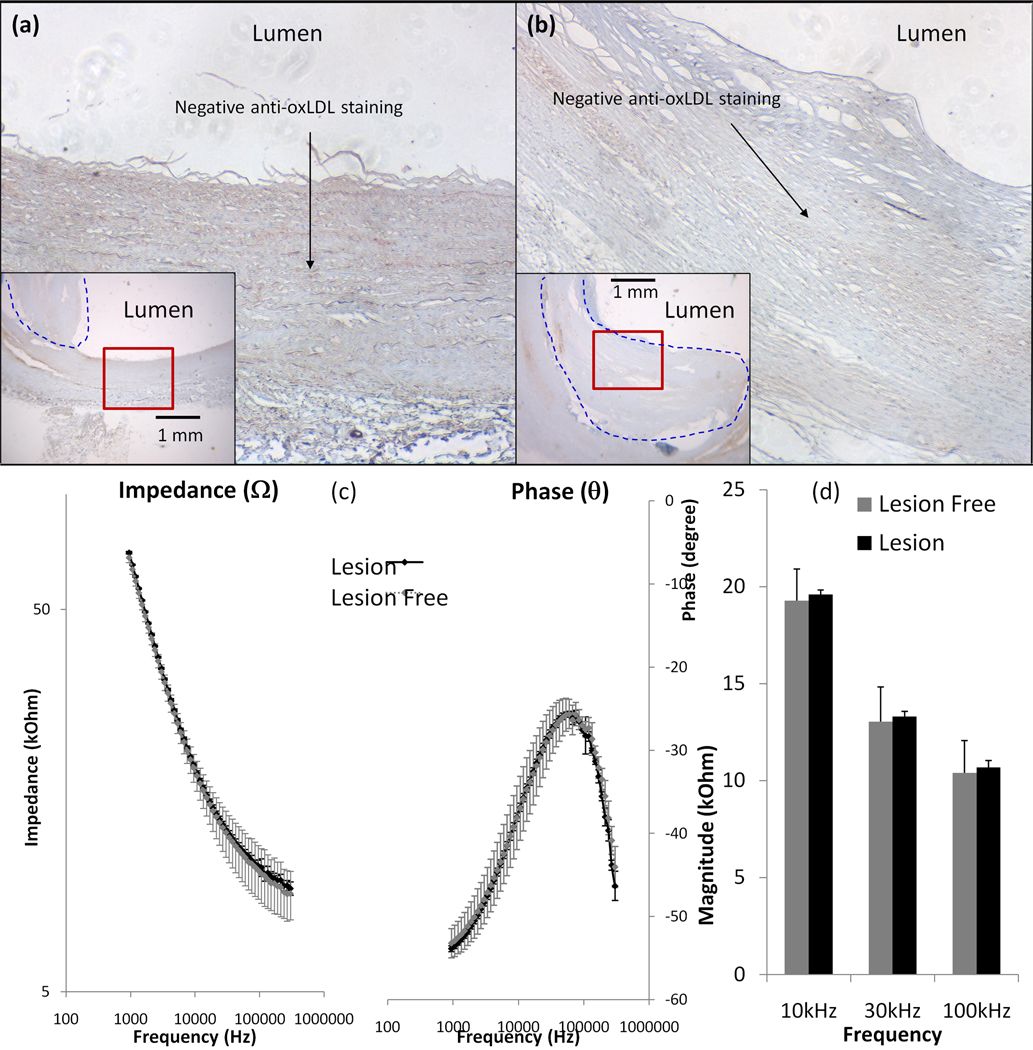
To assess the specificity for inflammatory states, we performed frequency-dependent EIS measurements to compare oxLDL-rich and -absent fibrous atheroma in en face human carotid arteries. Endoluminal EIS measurements compared between intimal hyperplasia and fibrous atheromas, followed by immunohistochemistry staining to reveal negative anti-oxLDL staining in both the lesion-free site (Fig. 4a) and the fibrous structure (Fig. 4b). Endoluminal EIS measurements showed a statistically insignificant difference in frequency-dependant impedance from 1 kHz to 300 kHz between the lesion-free sites and fibrous structures (Fig. 4c). The bar graph further supported statistically insignificant differences in impedances ranging from 10 kHz to 100 kHz (p > 0.05, n = 4 for lesion-free and n = 6 for fibrous atheromas) (Fig. 4d). Despite the presence of fibrous structure, insignificant changes in EIS measurements were consistent with the oxLDL-absent lesions (Type V).
Figure 4. Endoluminal EIS measurements of oxLDL-absent fibrous atheroma.
(a) Anti-oxLDL staining was negative in the lesion-free site. (b) Anti-oxLDL staining was also negative in the fibrous atheroma. (c) Frequency-dependent endoluminal tissue impedance from 1 kHz to 300 kHz between lesion-free regions and fibrous structures were statistically insignificant. (d) Bar graph also revealed insignificant difference in frequency-dependent impedance from 10 kHz to 100 kHz (p > 0.05, n = 4 for lesion-free and n = 6 for oxLDL-absent fibrous atheroma).
3.5 Elevated endoluminal EIS readings in the calcific atheromas
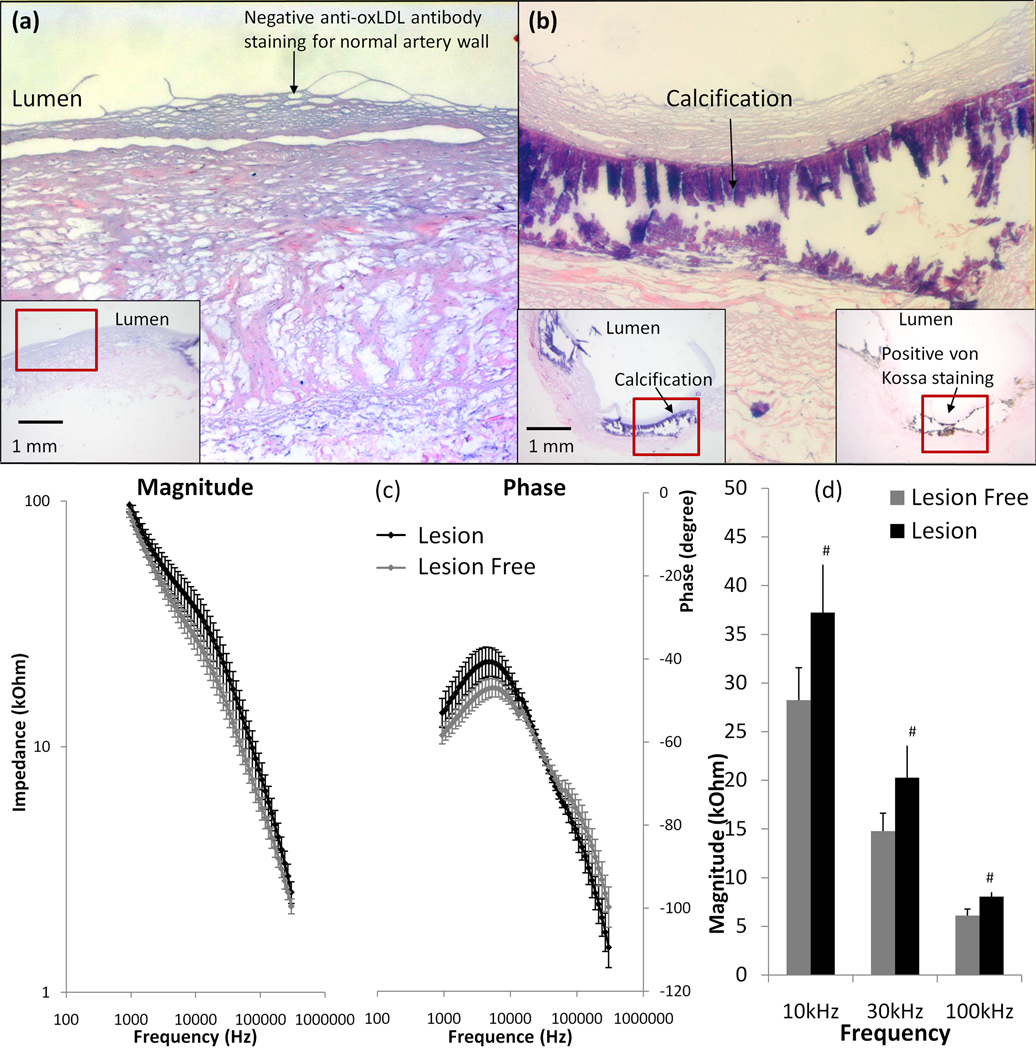
To further assess frequency-dependent EIS measurements in the presence of calcification, we performed EIS measurements in en face calcific atherosclerotic plaque from explants of human carotid arteries. H&E and immunohistochemistry revealed negative anti-oxLDL and von Kossa staining in the lesion-free sites (Fig. 5a), and positive von Kossa staining in the calcified lesions (Fig. 5b). The calcified core was dislodged during subsequent fixation, resulting in a void in the core. Endoluminal EIS measurements revealed an increase in impedance from 10 kHz to 100 kHz in the calcified lesions (Fig. 5c). The maximal phase difference between lesion-free and calcified regions was at ~6 kHz. The bar graph demonstrated a statistically significant difference in impedance ranging from 10 kHz to 100 kHz (p < 0.01, n = 4 for calcification and n = 6 for calcification-free regions) (Fig. 5d). Therefore, we demonstrate that calcific lesions (type VII) also engendered a significant increase in tissue impedance.
Figure 5. Endoluminal EIS measurements of calcification.
(a) Both anti-oxLDL and von Kossa staining was negative in the lesion-free regions. (b) Both H&E and von Kossa staining supported the presence of calcification. (c) Endoluminal EIS measurements revealed an increase in impedance from 10 kHz to 100 kHz in the presence of calcified lesions. The maximum phase difference between lesion-free region and calcified lesions developed at ~6 kHz. (d) Maximum difference in impedance was observed from 10 kHz to 100 kHz (p < 0.01, n = 4 for calcification and n = 6 for calcification-free sites).
3.6 Sensitivity and Specificity of endoluminal EIS measurements
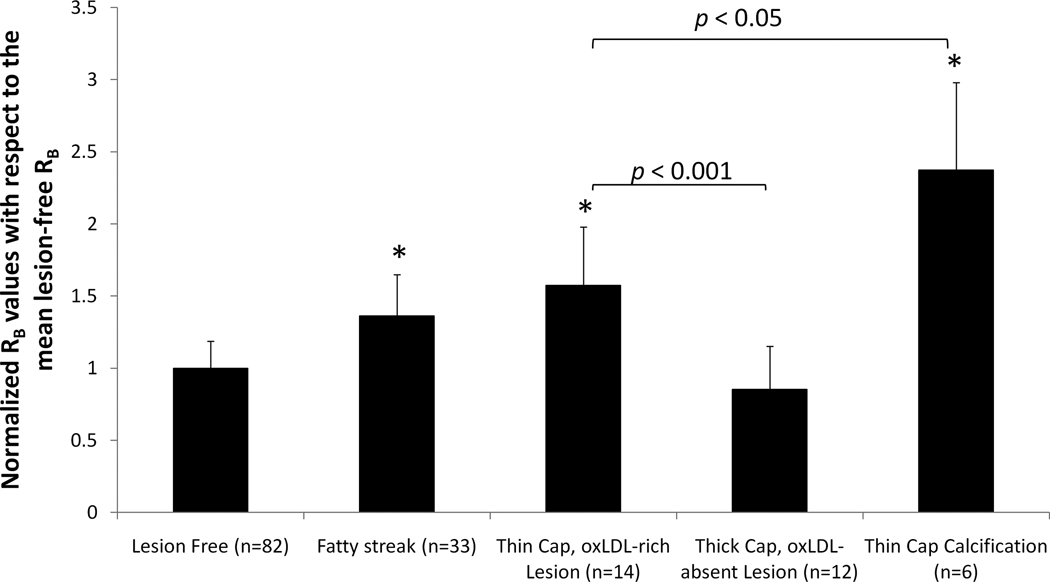
To provide sensitivity and specificity of EIS signals, we analyzed the RB (biological component resistance) values derived from the aforementioned Equivalent Circuit 2 (Fig. 1b). We normalized RB values from lesion sites to the mean RB values from the lesion-free sites in the identical specimen. We provided statistically significant differences in RB values among Type II lesions (fatty streaks), Type III or IV lesions (thin-cap oxLDL-rich atheroma) and Type VII lesions (calcification) (*p < 0.001) compared to the lesion-free sites. We further corroborated statistically significant differences between ox-LDL-rich and ox-LDL-absent fibrous atheromas (#p < 0.001), and between oxLDL-rich and calcific lesions (p < 0.05) (Fig. 6). In sum, our electrochemical strategy establishes sensitive and specific application of EIS measurements to detect inflammatory states of the atherosclerotic lesions.
Figure 6. Sensitivity and specificity of Endoluminal EIS measurements.
The RB (biological component resistance) values were calculated using Equivalent Circuit 2 (Fig. 1) and normalized to the mean RB values from lesion-free sites on the same specimens. Arterial specimens with Type II lesions (fatty streaks), Type III or IV lesions (thin cap oxLDL-rich atheroma) and Type VII lesions (calcification) demonstrated significantly higher RB values (*p < 0.001 compared to lesion-free sites). However, RB values in oxLDL-absent fibrous atheroma (Type V or Type VIII) were similar to lesion-free sites (p > 0.05). In addition, statistically significant difference in RB values were observed between oxLDL-rich and oxLDL-absent fibrous atheromas (p < 0.001), as well as between oxLDL-rich fibrous atheromas and calcified lesions (p < 0.05).
4. Discussion
In this study, electrochemical characterization of fibrous atheromas in terms of impedance spectroscopy and bioactive lipids offers a novel entry point to identify the high-risk and rupture-prone plaques. We established an Equivalent Circuit model to analyze our EIS measurements. We demonstrated that oxLDL within the fibrous atheroma engendered distinct frequency-dependent EIS measurements. To corroborate the specificity of tissue resistance values (RB), we provided statistically significant differences in the frequency-dependent EIS signals among fatty streaks (Stary Type II lesions), thin fibrous cap oxLDL-rich (Type III or IV), oxLDL absent fibroatheroma (Type V), and calcified lesions (type VII). Thus, we demonstrated a sensitive and specific electrochemical strategy to detect the inflammatory states of atherosclerotic lesions.
EIS is an emerging approach for biosensing applications (Lisdat and Schäfer 2008). For in vitro biosensing applications, a large surface area provided by the inert platinum or carbon electrode is commonly used as the counter electrode, providing both high charge transfer resistance and double-layer capacitance. For this reason, the overall impedance contributed by counter electrode is considered negligible. For intravascular EIS applications requiring high spatial resolution, the confined space in the catheters warrants close packaging of both the counter and working electrodes. For this reason, EIS measurements must account for the electrochemical interference at both the counter and working electrode interfaces.
In light of the paucity of literature for modeling equivalent circuits for the concentric bipolar electrode-tissue interface, we constructed three models to include both working and counter electrode interface as well as tissue impedance. The sensitivity and specificity of intravascular EIS measurements depend on various biochemical and physical parameters. Surface roughness and electrochemical properties of the electrodes, artery wall thickness and geometry contribute to accurate modeling of the Equivalent Circuits. In the current study, we demonstrate that Equivalent Circuit 2 (Fig. 1b) is an optimal model to simulate endoluminal EIS measurements for modeling the electrical resistive and capacitive properties of the tissue in the vicinity of concentric bipolar electrodes.
The principle of EIS analysis for biological tissue is based on the premises that gross tissue impedance is closely related to tissue water content and electrolyte concentration. Fat-free tissue is known as a good electrical conductor for its high water (approximately 73%) and electrolytes content (ions and proteins). However, fat tissue is anhydrous and thus, a poor conductor. In corollary, atherosclerotic lesions display distinct electrochemical properties (Streitner et al. 2009; Suselbeck et al. 2005). The high lipid content, including the negatively charged active lipids such as oxidized Low-Density Lipoprotein (oxLDL) present in the pro-inflammatory lesions (Sevanian et al. 1996), engenders distinct electrochemical properties in the vessel wall that can be measured by EIS.
Oxidized LDL induces the transformation of macrophages into lipid-laden foam cells (Brown and Goldstein 1983), and activated macrophages secrete factors such as matrix metalloproteinases (MMPs) to mechanically destabilize plaques (Cheng et al. 1997; Kim et al. 2009). Growing evidence suggests that oxLDL and thin-cap fibroatheromas (TCFA) rich in macrophage/foam cells are more prone to mechanical stress and destabilization (Chinetti-Gbaguidi et al. 2011; Ehara et al. 2001; Zeibig et al. 2011). Hence, EIS allows for characterization of the electrical properties at the electrode and biological interfaces (Lisdat and Schäfer 2008). Intravascular deployment of EIS-based 4-point electrode probe was reported for detecting atherosclerotic lesions (Cho and Thielecke 2006; Konings et al. 1997b; Stiles and Oakley 2003; Streitner et al. 2009; Suselbeck et al. 2005). We further revealed that active lipids and macrophages engendered distinct electrochemical properties that can be measured by EIS via the concentric bipolar microelectrodes (Yu et al. 2011).
To establish sensitive and specific strategy for inflammatory states underneath the fibrous caps, we demonstrate distinct differences in tissue resistance (RB) among fatty streaks (Stary Type II lesions), thin fibrous cap oxLDL-rich (Type III or IV), and calcified lesions (type VII) in en face human carotid arteries. Furthermore, RB value was significantly elevated in the oxLDL-rich atheromas and fatty streaks compared to oxLDL-absent fibroatheromas, and the difference in RB values were statistically insignificant between oxLDL-absent fibroatheromas and the lesion-free regions (Fig. 6). It is recognized that tissue resistance to electrical current is dependent on its intrinsic property in terms of water content and free-moving electrolytes. We postulate that despite intimal hyperplasia and smooth muscle cell migration to the endoluminal surface, oxLDL-absent fibroatheromas harbor comparable water and ionic contents like the rest of the vessel wall, thus rendering a good electric conductor and a low resistivity path for current flow. In contrast, the lipid core beneath the fibrous atheroma harbors low water content, resulting in a poor electrical conductor and a high resistivity path for current flow, thus confining the electrical current flow to the thin fibrous layer of atheroma. In corollary, the calcified core in Type VII lesions is analogous to a salt crystal and an insulator, thus, rendering a high resistivity path. In this context, endoluminal EIS signals were elevated in the presence of both active lipids and calcification, while the normalized RB was significantly higher in the calcific atheromas (Fig. 6).
In addition to the normalized RB values, intravascular ultrasound (IVUS) can be applied to distinguish lipid-rich atheroma from calcification. Fibrous cap oxLDL-rich atheroma generates echolucency while the calcified lesions engenders high echogenicity (Yamada et al. 2011). Thus, integration of EIS signals with IVUS images holds promise to co-register non-obstructive lesions (< 20% stenosis) harboring active lipids and inflammatory foam cells that were otherwise considered clinically silent, and were previously reported to have no significantly different impedance compared with the healthy aorta (Suselbeck et al. 2005).
Currently, the advent of near-infrared fluorescence (NIRF) provides cystein protease activity as an indicator of inflammation (Jaffer et al. 2008). However, contrast dye injection is indicated. The use of glucose analogue [18F]-fluorodeoxyglucose (18FDG) also provides metabolic activity by Positron Emission Tomography (PET) (Rudd et al. 2002). However, radioisotope is required and the spatial resolution remains inadequate. Encouraging findings from the high-frequency dual ultrasound (US) and optical coherence tomographic (OCT) probe demonstrate the feasibility to detect both high resolution thin-cap fibroatheroma (TCFA) and intimal hyperplasia (Li et al. 2010). Integrating the aforementioned US-OCT system with our novel electrochemical approach to detect active lipids and macrophages in the vessel wall will further establish the capacity to characterize intimal thickening, calcification, thin fibrous cap, calcification and metabolic states.
5. Conclusion
We hereby assessed endoluminal impedance in explants of human arteries via a concentric bipolar electrode, and provided a sensitive and specific electrochemical strategy to characterize fibrous cap atheromas in terms of impedance spectroscopy and active lipids content. We demonstrate that high content of bioactive metabolic factors within the fibrous atheroma engendered distinct frequency-dependent electrochemical impedance spectra. Histology and immunohistochemistry for active lipids and calcification further validated specificity of the EIS measurements for active metabolic states in en face human arteries.
Highlights.
>We use electrochemical impedance spectroscopy(EIS) to assess atherosclerotic plaques. >Ex vivo concentric bipolar microelectrode EIS measurement correlate with lesion type. >We construct equivalent circuit model to identify and analyze tissue resistance. >oxLDL-rich lesion has statistically higher tissue resistance compare to fibroatheroma. >EIS is a potentially sensitive and specific strategy for high-risk lesion diagnosis.
Supplementary Material
Acknowledgments
FUNDING SOURCES
This project was supported by grants from the National Institutes of Health National Heart Lung and Blood Institute, HL091302 (TKH) and HL083015 (TKH), and the American Heart Association Pre-Doctoral Fellowship 11PRE7370088 (FY).
Footnotes
Publisher's Disclaimer: This is a PDF file of an unedited manuscript that has been accepted for publication. As a service to our customers we are providing this early version of the manuscript. The manuscript will undergo copyediting, typesetting, and review of the resulting proof before it is published in its final citable form. Please note that during the production process errors may be discovered which could affect the content, and all legal disclaimers that apply to the journal pertain.
DISCLOSURES
The authors have no conflicts of interest.
Reference
- Ambrose JA, Tannenbaum MA, Alexopoulos D, Hjemdahl-Monsen CE, Leavy J, Weiss M, Borrico S, Gorlin R, Fuster V. Lead Article. 1988;12:184–202. doi: 10.1016/0735-1097(88)90356-7. [DOI] [PubMed] [Google Scholar]
- Anderson JL, Adams CD, Antman EM, Bridges CR, Califf RM, Casey DE, Jr, Chavey II, William E, Fesmire FM, Hochman JS. Journal of the American College of Cardiology. 2007;50(7):652–726. doi: 10.1016/j.jacc.2007.02.013. [DOI] [PubMed] [Google Scholar]
- Brown MS, Goldstein JL. Annual Review of Biochemistry. 1983;52(1):223–261. doi: 10.1146/annurev.bi.52.070183.001255. [DOI] [PubMed] [Google Scholar]
- Cheng GC, Briggs WH, Gerson DS, Libby P, Grodzinsky AJ, Gray ML, Lee RT. Circulation Research. 1997;80(1):28–36. doi: 10.1161/01.res.80.1.28. [DOI] [PubMed] [Google Scholar]
- Chinetti-Gbaguidi G, Baron M, Bouhlel MA, Vanhoutte J, Copin C, Sebti Y, Derudas B, Mayi T, Bories G, Tailleux A. Circulation Research. 2011;108(8):985–995. doi: 10.1161/CIRCRESAHA.110.233775. [DOI] [PMC free article] [PubMed] [Google Scholar]
- Cho S, Thielecke H. Biomedical Engineering, IEEE Transactions on. 2006;53(11):2401–2404. doi: 10.1109/TBME.2006.883616. [DOI] [PubMed] [Google Scholar]
- Ehara S, Ueda M, Naruko T, Haze K, Itoh A, Otsuka M, Komatsu R, Matsuo T, Itabe H, Takano T, Tsukamoto Y, Yoshiyama M, Takeuchi K, Yoshikawa J, Becker AE. Circulation. 2001;103(15):1955–1960. doi: 10.1161/01.cir.103.15.1955. [DOI] [PubMed] [Google Scholar]
- Finn AV, Nakano M, Narula J, Kolodgie FD, Virmani R. Arteriosclerosis, Thrombosis, and Vascular Biology. 2010;30(7):1282–1292. doi: 10.1161/ATVBAHA.108.179739. [DOI] [PubMed] [Google Scholar]
- Fuster V, Badimon L, Badimon JJ, Chesebro JH. The New England journal of medicine. 1992;326(4):242–250. doi: 10.1056/NEJM199201233260406. [DOI] [PubMed] [Google Scholar]
- Jaffer FA, Vinegoni C, John MC, Aikawa E, Gold HK, Finn AV, Ntziachristos V, Libby P, Weissleder R. Circulation. 2008;118(18):1802–1809. doi: 10.1161/CIRCULATIONAHA.108.785881. [DOI] [PMC free article] [PubMed] [Google Scholar]
- Kim YS, Galis ZS, Rachev A, Han HC, Vito RP. Journal of Biomechanical Engineering. 2009;131(1):011009–011018. doi: 10.1115/1.3005163. [DOI] [PMC free article] [PubMed] [Google Scholar]
- Konings MK, Mali W, Viergever MA. IEEE Transactions on Medical Imaging. 1997a;16(4):439–446. doi: 10.1109/42.611353. [DOI] [PubMed] [Google Scholar]
- Konings MK, Mali W, Viergever MA. IEEE Transaction on Medical Imaging. 1997b;16(4):439–446. doi: 10.1109/42.611353. [DOI] [PubMed] [Google Scholar]
- Li X, Yin J, Hu C, Zhou Q, Shung KK, Chen Z. Applied Physics Letters. 2010;97:133702–133704. doi: 10.1063/1.3493659. [DOI] [PMC free article] [PubMed] [Google Scholar]
- Lisdat F, Schäfer D. Analytical and Bioanalytical Chemistry. 2008;391(5):1555–1567. doi: 10.1007/s00216-008-1970-7. [DOI] [PubMed] [Google Scholar]
- Little WC, Constantinescu M, Applegate RJ, Kutcher MA, Burrows MT, Kahl FR, Santamore WP. Circulation. 1988;78(5):1157–1166. doi: 10.1161/01.cir.78.5.1157. [DOI] [PubMed] [Google Scholar]
- Marcu L, Fishbein MC, Maarek JMI, Grundfest WS. Arteriosclerosis, Thrombosis, and Vascular Biology. 2001;21(7):1244–1250. doi: 10.1161/hq0701.092091. [DOI] [PubMed] [Google Scholar]
- Ross R. American Heart Journal. 1999;138(5 Pt 2):S419–S420. doi: 10.1016/s0002-8703(99)70266-8. [DOI] [PubMed] [Google Scholar]
- Rudd J, Warburton E, Fryer T, Jones H, Clark J, Antoun N, Johnstrom P, Davenport A, Kirkpatrick P, Arch BN. Circulation. 2002;105(23):2708. doi: 10.1161/01.cir.0000020548.60110.76. [DOI] [PubMed] [Google Scholar]
- Sanz J, Fayad ZA. Nature. 2008;451(7181):953–957. doi: 10.1038/nature06803. [DOI] [PubMed] [Google Scholar]
- Sevanian A, Hwang J, Hodis H, Cazzolato G, Avogaro P, Bittolo-Bon G. Arteriosclerosis, Thrombosis, and Vascular Biology. 1996;16(6):784–793. doi: 10.1161/01.atv.16.6.784. [DOI] [PubMed] [Google Scholar]
- Stary HC. Arterioscler Thromb Vasc Biol. 2000;20(5):1177–1178. doi: 10.1161/01.atv.20.5.1177. [DOI] [PubMed] [Google Scholar]
- Stary HC, Chandler AB, Dinsmore RE, Fuster V, Glagov S, Insull WJ, Rosenfeld ME, Schwartz CJ, Wagner WD, Wissler RW. Arterioscler Thromb Vasc Biol. 1995;15(9):1512–1531. doi: 10.1161/01.atv.15.9.1512. [DOI] [PubMed] [Google Scholar]
- Stiles DK, Oakley B. Biomedical Engineering, IEEE Transactions on. 2003;50(7):916–921. doi: 10.1109/TBME.2003.813545. [DOI] [PubMed] [Google Scholar]
- Streitner I, Goldhofer M, Cho S, Thielecke H, Kinscherf R, Streitner F, Metz J, Haase KK, Borggrefe M, Suselbeck T. Atherosclerosis. 2009;206(2):464–468. doi: 10.1016/j.atherosclerosis.2009.03.015. [DOI] [PubMed] [Google Scholar]
- Suselbeck T, Thielecke H, Kochlin J, Cho S, Weinschenk I, Metz J, Borggrefe M, Haase KK. Basic research in cardiology. 2005;100(5):446–452. doi: 10.1007/s00395-005-0527-6. [DOI] [PubMed] [Google Scholar]
- Vengrenyuk Y, Carlier S, Xanthos S, Cardoso L, Ganatos P, Virmani R, Einav S, Gilchrist L, Weinbaum S. Proc Natl Acad Sci U S A. 2006;103(40):14678–14683. doi: 10.1073/pnas.0606310103. [DOI] [PMC free article] [PubMed] [Google Scholar]
- Worthley SG, Helft G, Fuster V, Fayad ZA, Shinnar M, Minkoff LA, Schechter C, Fallon JT, Badimon JJ. Arteriosclerosis, Thrombosis, and Vascular Biology. 2003;23(2):346–350. doi: 10.1161/01.atv.0000053183.08854.a4. [DOI] [PubMed] [Google Scholar]
- Yamada R, Okura H, Miyamoto Y, Kawamoto T, Neishi Y, Hayashida A, Tsuchiya T, Nezuo S, Yoshida K. Journal of the American College of Cardiology. 2011;57(14):E1882–E1882. [Google Scholar]
- Yu F, Li R, Ai L, Edington C, Yu H, Barr ML, Kim ES, Hsiai TK. Annals of Biomedical Engineering. 2011;39(1):287–296. doi: 10.1007/s10439-010-0127-y. [DOI] [PMC free article] [PubMed] [Google Scholar]
- Zeibig S, Li Z, Wagner S, Holthoff HP, Ungerer M, Bultmann A, Uhland K, Vogelmann J, Simmet T, Gawaz M. Circulation Research. 2011;108:695–703. doi: 10.1161/CIRCRESAHA.111.240515. [DOI] [PubMed] [Google Scholar]
Associated Data
This section collects any data citations, data availability statements, or supplementary materials included in this article.


