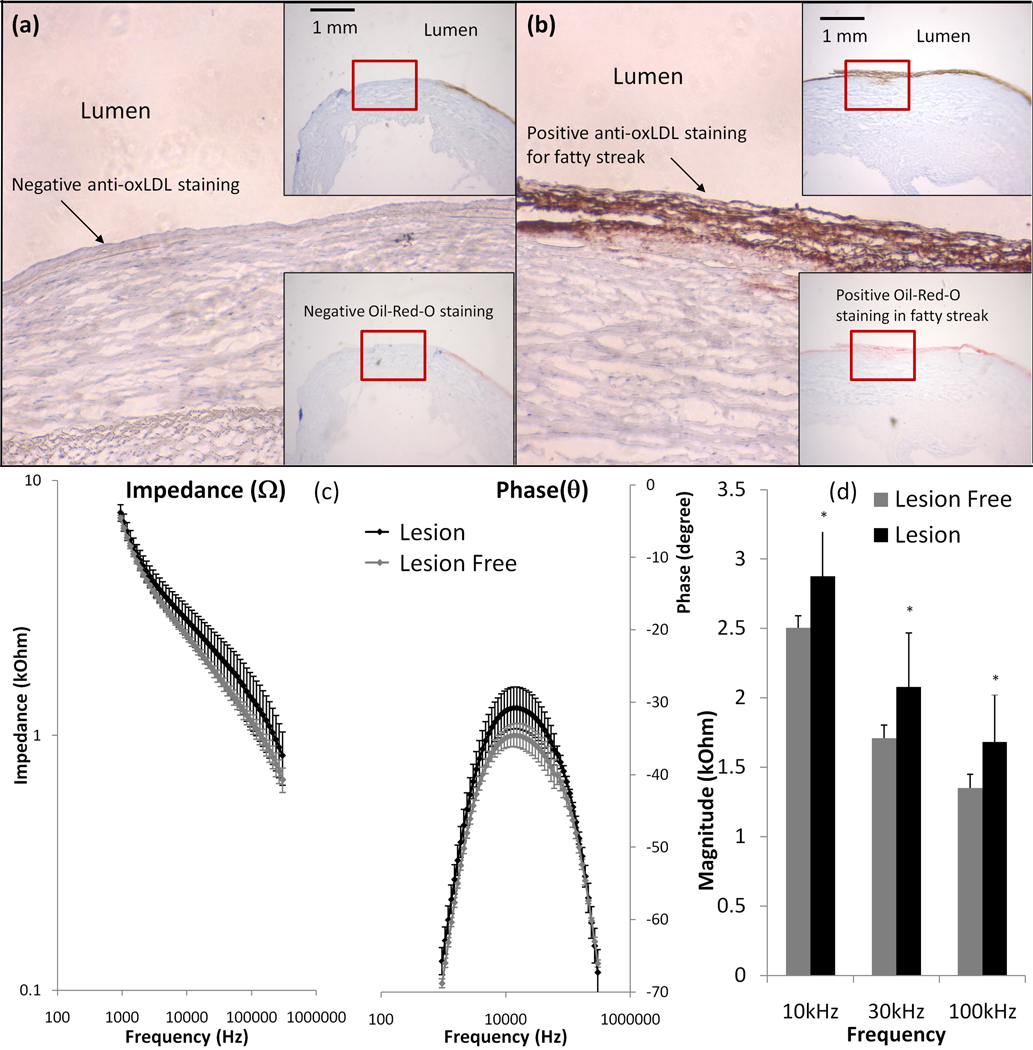
Figure 2. Endoluminal EIS measurements of fatty streaks.
(a) Anti-oxLDL staining was negative in the fatty streaks-free region. The right upper insert showed the luminal wall and right lower insert showed the corresponding negative Oil-red-O staining. (b) Both anti-oxLDL and Oil-Red-O were positive in the fatty streaks. (c) Endoluminal tissue impedance increased from 10 kHz to 300 kHz in the presence of fatty streaks. The maximum phase difference between lesion-free and fatty streak regions developed at ~10 kHz. Impedance measured from fatty streak sites appeared to have greater variance. (d) Statistically significant difference in impedance of lesion-free sites and fatty streak sites was observed from 10 kHz to 100 kHz (p <0.01, n = 10 for fatty streaks and n=8 for lesion-free).

