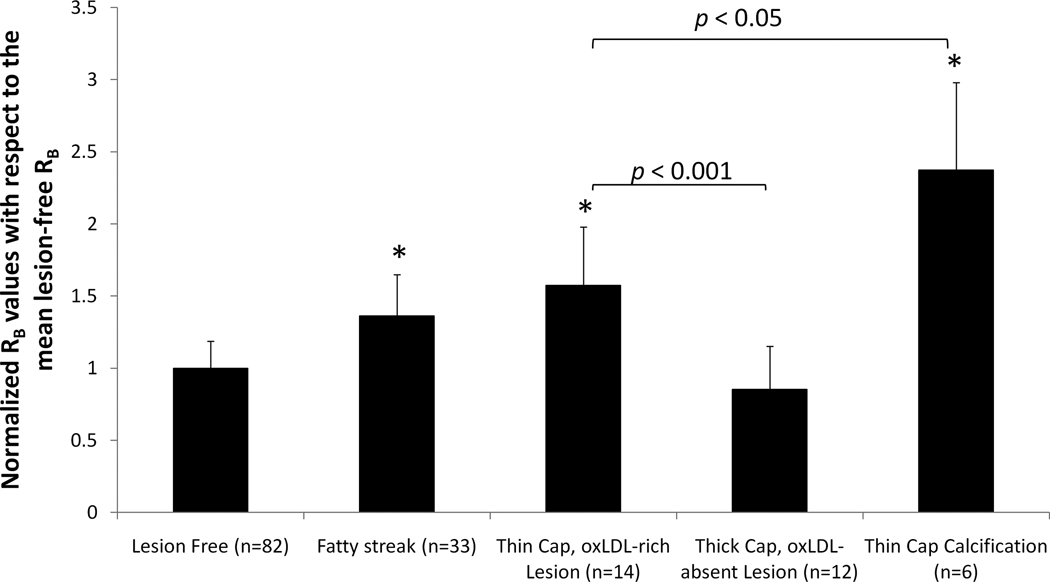
Figure 6. Sensitivity and specificity of Endoluminal EIS measurements.
The RB (biological component resistance) values were calculated using Equivalent Circuit 2 (Fig. 1) and normalized to the mean RB values from lesion-free sites on the same specimens. Arterial specimens with Type II lesions (fatty streaks), Type III or IV lesions (thin cap oxLDL-rich atheroma) and Type VII lesions (calcification) demonstrated significantly higher RB values (*p < 0.001 compared to lesion-free sites). However, RB values in oxLDL-absent fibrous atheroma (Type V or Type VIII) were similar to lesion-free sites (p > 0.05). In addition, statistically significant difference in RB values were observed between oxLDL-rich and oxLDL-absent fibrous atheromas (p < 0.001), as well as between oxLDL-rich fibrous atheromas and calcified lesions (p < 0.05).

