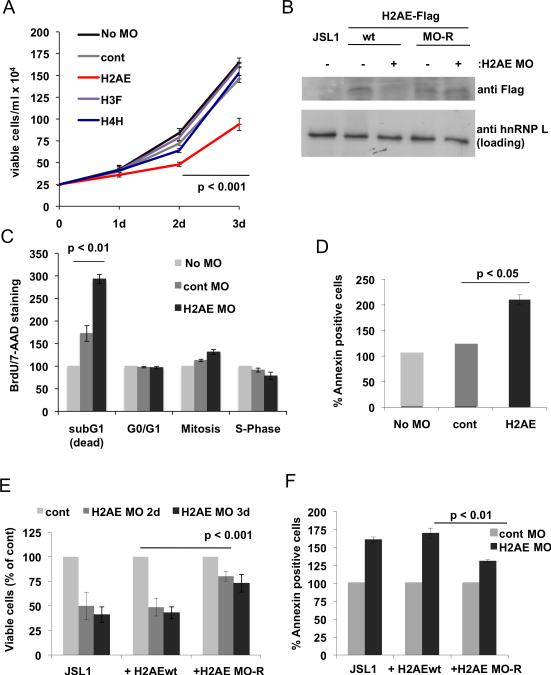
Fig. 4. Knock down of H2AE leads to increased apoptosis in T cells.
(A) Growth curve of JSL1 T cells transfected with the indicated Morpholino-oligomers (MOs). Data represent mean values of three independent transfections. (B) Stable cell lines were generated expressing either wt H2AE-Flag or a version with several silent point mutations (MO-R) in the region targeted by the MO. These cells were transfected with the H2AE MO and expression of H2AE-Flag was analyzed by Western blotting. (C) Cell cycle distribution of JSL1 cells 48h after transfection with the indicated MOs as assessed by BrdU/7-AAD staining. Shown is the percentage relative to control (untransfected) cells (n=3). (D) AnnexinV staining of cells as in C). (E) Cells transfected with the H2AE MO were counted at the indicated time points and expressed as percent of control MO transfected cells of the same genotype (n=3). (F) Apoptosis was analyzed by Annexin V staining 48h post MO transfection.

