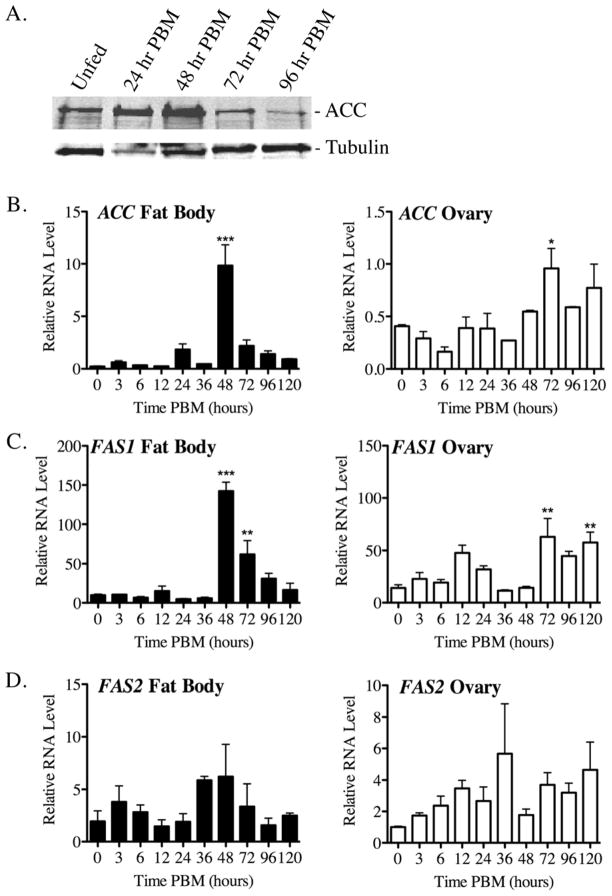
Figure 2.
ACC and FAS1 expression in fat body and ovary tissue of blood fed Ae. aegypti mosquitoes. A) QRT-PCR analysis of transcript levels in blood fed mosquitoes at various times PBM using data collected from three independent biological replicas. Relative values are plotted as the Mean ± SEM using ribosomal S7 transcripts as an internal control across all samples. Asterisks indicate a significant difference between individual time points PBM and unfed mosquitoes (*P<0.05; ** P < 0.01; *** P < 0.001). B) Representative western blot of ACC protein levels in the fat body at various times PBM using a commercial antibody that cross-reacts with the Ae. aegypti ACC protein. The protein loading control is α-tubulin.

