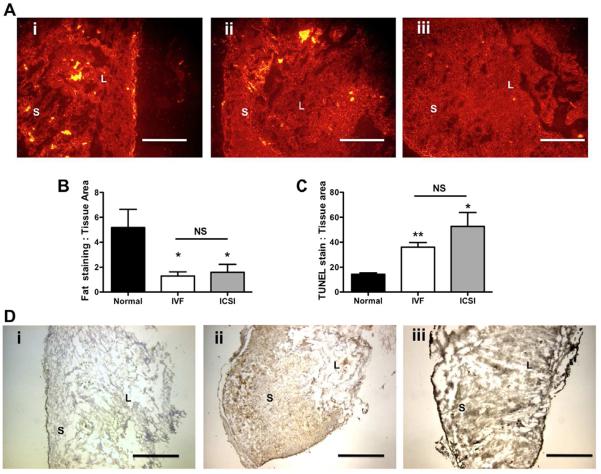
Figure 1. Immunofluorescence and histopathology analyses of placental lipid loading and apoptosis in placentas from normal and assisted fertilization pregnancies.
1A: Representative immunofluorescent images of mouse placentas stained with Nile Red at 10× magnification oriented with the chorionic plate to the right in all slides (scale bar = 250 μm) (i) Normal fertilization, (ii) IVF, (iii) ICSI. 1B: Semi-quantification of fluorescence using fluorescence:tissue area pixel ratio. Bars are means ± SEM. 1C: Semi-quantification of apoptosis measured by TUNEL staining:tissue area pixel ratio analyzed in Image J. 1D: Representative micrographs of TUNEL staining in the mouse placenta at 4× magnification (i) Normal fertilization, (ii) IVF, (iii) ICSI. Scale bar = 1 mm. Bars are means ± SEM. * = P < 0.05, ** = P < 0.01 vs. normal fertilization, t-test. Abbreviations S = syncytium, L = labyrinth zone. NS = not significant.

