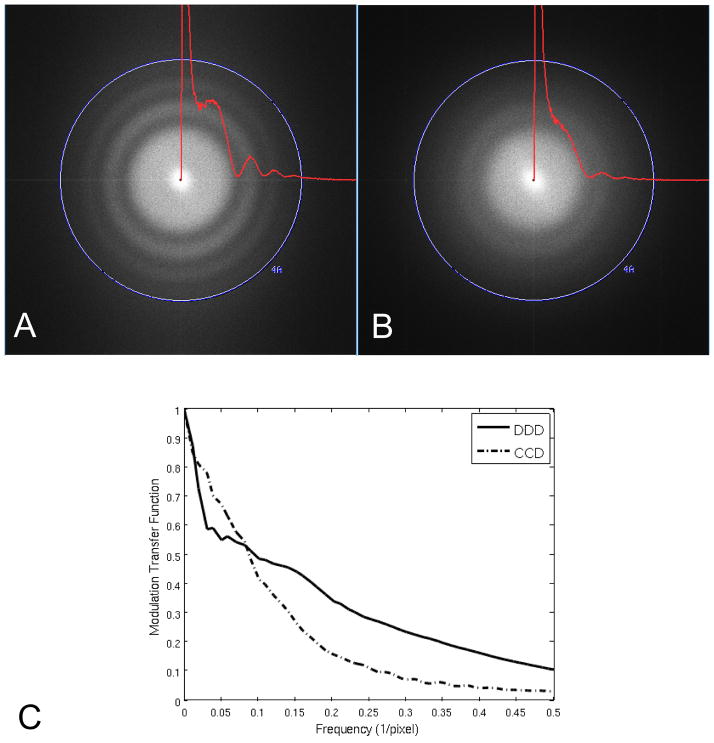
Figure 1.
Comparison of detection limit between cameras installed on the same microscope using identical instrument conditions and almost matching pixel size. Fourier transforms and radially averaged power spectra of 3K × 3K cropped images from: (A) DDD (1.38Å/pixel) and (B) CCD (1.37Å/pixel). High tension 200 KeV, electron dose ~20e−/Å2, exposure time 400ms. The modulation transfer function is shown in (C) for the CCD and DDD cameras calculated using the edge method.

