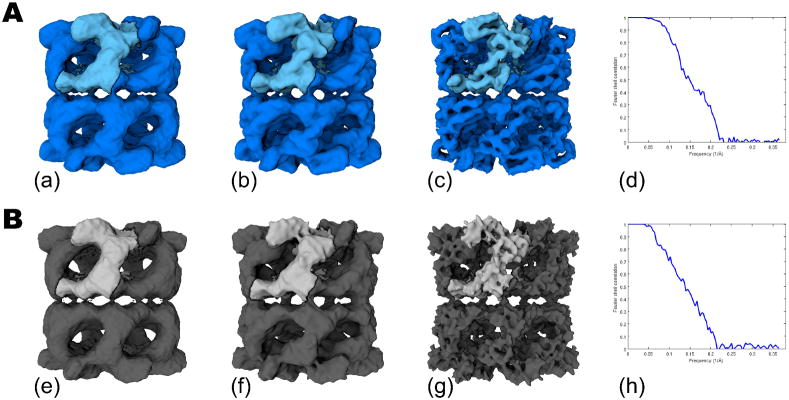
Figure 3.
GroEL reconstructions from ~30K particle data sets comparing DDD in (A) and the CCD camera in (B). The final volumes with no post processing are shown in (a) and (e). Maps shown in (b) and (f) were amplitude corrected with an X-ray scattering curve out to 8Å and low pass filtered to 7.5Å. Volumes shown in (c) and (g) were amplitude corrected with an X-ray scattering curve out to 5Å and low pass filtered to 6Å. The Fourier Shell Correlation plots for (a) and (e) are shown in (d) and (h).

