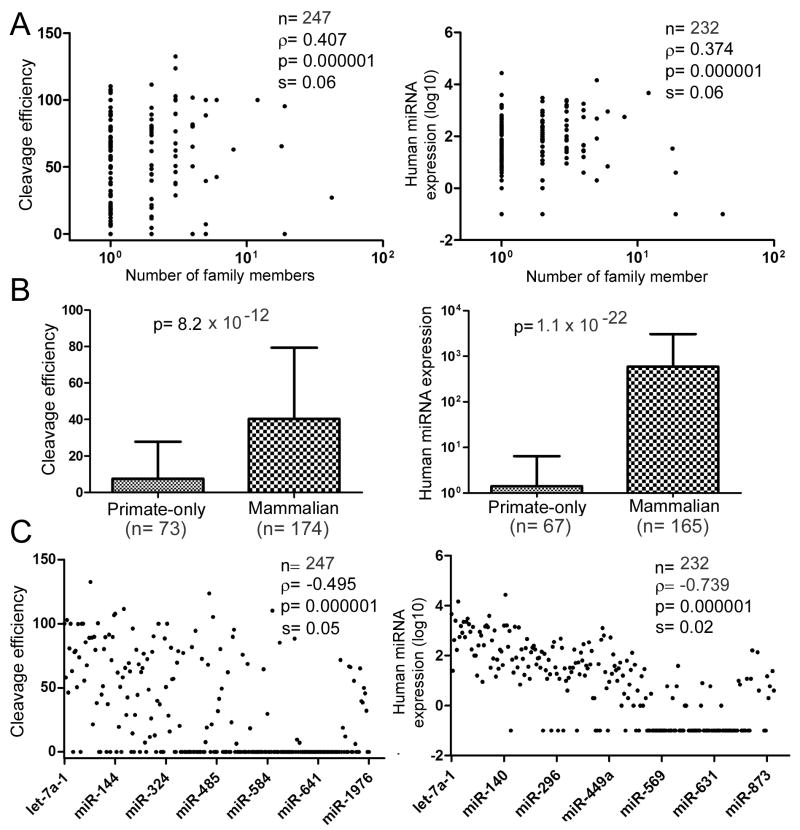
Figure 4.
Relationship between miRNA processing or expression and the conservation or the order of discovery of miRNAs. See Figure 2 for explanation of the symbols and Supplementary Table S3 for data. (A) Spearman rank correlation between the number of miRNA gene family members and relative Drosha cleavage efficiencies or human miRNA expression. (B) Relationship between miRNA conservation and relative Drosha cleavage efficiencies or human miRNA expression. Human miRNAs are divided into two categories, one present in only primates, and the other present in at least other mammals. Sample size, averages, standard deviations, and p-values are shown (Mann-Whitney U test). (C) Spearman rank correlation between the order of miRNA discovery and relative Drosha cleavage efficiencies or human miRNA expression.

