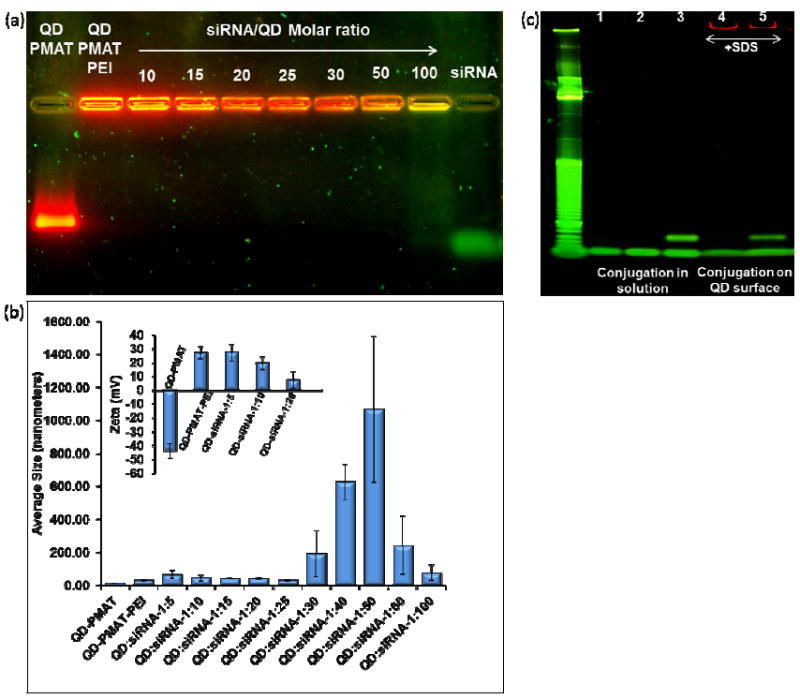
Figure 2.

Characterization of the two-step QD-chimera formation process. (a) Determination of siRNA loading capacity on QD-PMAT-PEI surface. 20 pmole of siRNA is mixed with QDs at various molar ratios (10, 15, 20, 25, 30, 50, and 100). Free siRNA are undetectable up to 1:50 siRNA:QD molar ratio, however at 1:100 ratio the green flourescence of SYBR gold-stained siRNA can be seen indicating that at least 50 siRNA molecules can bind onto each QD. (b & insert) Hydrodynamic size and zeta potential measured by DLS of QD-PMAT-PEI nanoparticles before and after siRNA loading. The particle size of the complexes increases with increasing siRNA/QD molar ratio 5, 10, 15, 20, 25, 30, 40, 50, 60 and 100 as follows 66.3 ± 23.8 nm, 46.0 ± 18.9 nm, 42.4 ± 4.29 nm, 41.6 ± 5.0 nm, 31.4 ± 3.9 nm, 193.1 ± 141.3 nm, 625.7 ± 106.4 nm, 1067.8 ± 443.0 nm, 243 ± 177.5 nm, 76.5 ± 47.8 nm respectively. The zeta potential values for QD-PMAT and QD-PMAT-PEI are -43.9 ± 5.3 mV and 27.0 ± 4.5 mV. After siRNA binding at siRNA/QD molar ratio 5, 10, and 20, the values become 27.4 ± 6.1 mV, 19.6 ± 4.5 mV, and 7.7 ± 6.3 mV, respectively. The average values and error bars are calculated based on three runs. (c) Polyacrylamide gel (10%) characterization of thiol-aptamer conjugation with siRNA-SPDP after complexation on QD surface. Lane 1-5 are siRNA, aptamer, siRNA-aptamer chimera formed in solution, QD-siRNA with SDS, and chimera formed on QD surface with SDS, respectively. The DNA ladder on the left is a 10bp ladder (Track it Orange, Invitrogen). The yield of the siRNA –aptamer conjugation reaction does not change with or without QDs.
