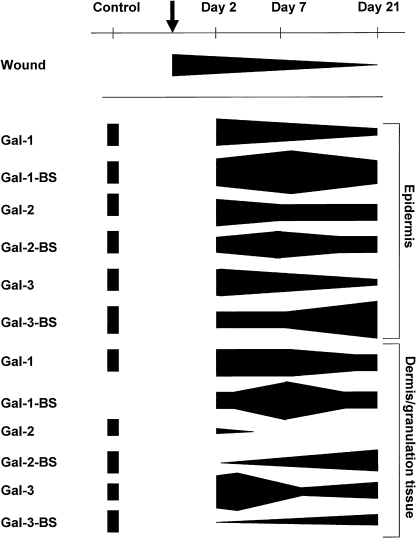
Fig. 3.
Computation of the staining data on semi-quantitative scale for the tested galectins and respective binding sites in epidermis and in the dermis/granulation tissue at the three given time points during the healing process (top row) with respect to wound closure. Arrow indicates the moment of wounding.

