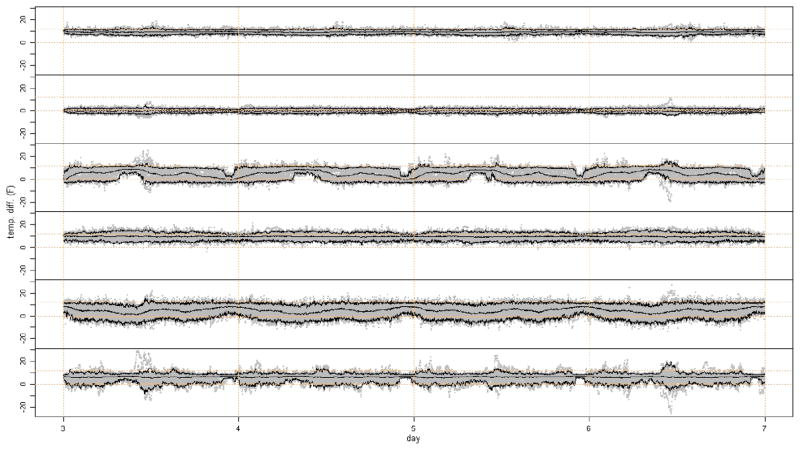
Figure 7.
Four days of predicted power dissipation/production for group of six ACs under the shutdown of the second unit. A total of 50 simulations are in gray. Each simulation is generated by redistributing the average heat load for unit two to the average heat loads for the remaining units for each state using independent Dirichlet(1, …, 1) random proportions. The other parameters are fixed at their fitted values. Predicted average trace and 95% pointwise individual prediction intervals under the Dirichlet redistribution scheme are in black. A color version of this figure is available in the electronic version of this article.

