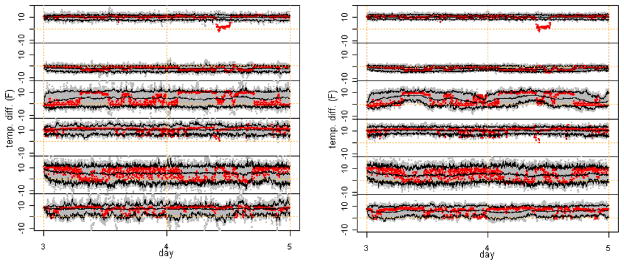
Figure 9.
Two days of predicted power dissipation/production for group of six ACs under simplified models. The 50 simulations are in gray, and predicted averages and individual, pointwise 95% prediction intervals are in black. Left panel: Transition matrix At assumed constant in time t. Right panel: Innovation variances Σk0 and autoregressive coefficients assumed constant across states k0. The online version of this figure is in color.

