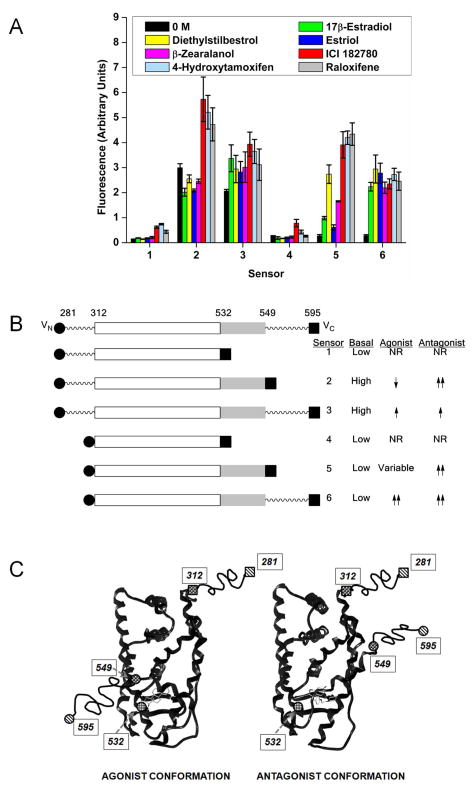
Fig. 3.
(A) Sensor performance with agonists and antagonists. Sensors 1–6 were transiently transfected into HeLa cells and exposed to 0.1% ethanol control or 100 nM of the agonists 17β-estradiol, diethylstilbestrol, estriol, or β-zearalanol, or the antagonist/selective estrogen receptor modulators ICI 182780, 4-hydroxytamoxifen, or raloxifene. Data shown is the mean and standard error of the mean for two or more independent experiments. (B) Schematic representation of the sensors. The portion of the ERα LBD found highly structured in crystal structures is shown as a boxed area (roughly from 305 to 549), with the portion representing helix-12 shown in light gray. The sites of truncation at the N-terminus (281 and 312) and at the C-terminus (532, 549, and 595) are indicated. (C) Cartoon representing the proposed localization of the split sensor fragments in response to agonist or antagonist bound ER ligand binding domain, and helix-12 (roughly position 537-549) conformation change. Because the sequence positions at the far N- and C-termini (281 and 595) are beyond that of known crystal structures, these are connected to the structured core by wavy lines. Representative structures of the estrogen receptor with agonist or antagonist bound can be found in the protein data bank under accession numbers 1ERE and 1ERR.

