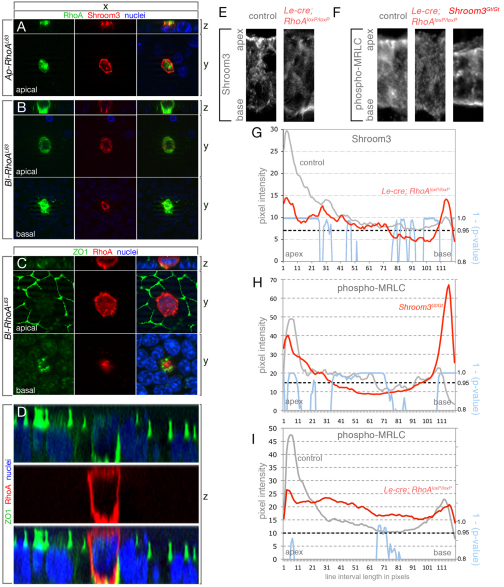
Fig. 3.
RhoA activity is necessary and sufficient for Shroom3 apical localization. (A,B) Immunofluorescent labeling of MDCK cells co-expressing exogenous Shroom3 (red) and regionally targeted versions of constitutively active RhoA (green). Nuclei are in blue. The xz plane allows visualization of the apical-basal axis and the xy plane a view of the apex or base. The xz view shows that VSVG-RhoAL63 (Ap-RhoAL63) is targeted apically (A) whereas Fcgr2b-RhoAL63 (Bl-RhoAL63) targets basolaterally (B). (C) Immunofluorescent labeling for ZO1 (green) of an MDCK cell expressing Bl-RhoAL63 (red). Nuclei are in blue. (D) xz plane of a field of MDCK cells labeled for ZO1 (green) and nuclei (blue) in which one is expressing Bl-RhoAL63 (red). In this cell, ZO1 labeling is adjacent to the adhesion substrate. (E,F) Immunofluorescent labeling of Shroom3 (E) or phospho-MRLC (F) in wild-type or mutant E10.5 lens pit cryosections. (G-I) The average pixel intensity following immunolabeling with Shroom3 (G) or phospho-MRLC (H-I) specific antibodies was quantified over apical-basal line intervals for control (gray) or mutant (red) genotypes. The means are calculated from ≥17 cells from at least four different lens pits. Statistically significant differences were evaluated by calculating P-values (see Materials and methods) for each pixel along the apical-basal axis. The blue line indicates the trend of statistical P-values subtracted from 1 and values greater than 0.95 (P<0.05) indicate regions in which a statistically significant difference in signal intensity is found.

