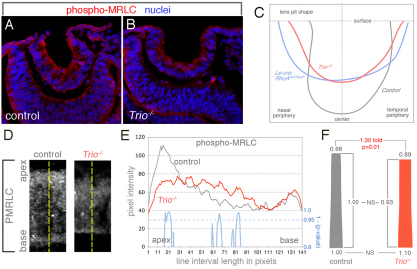
Fig. 6.
Trio regulates apical constriction during mouse lens pit invagination. (A,B) Wild-type (A) or Trio-deficient (B) cryosectioned E10.5 mouse embryos were labeled for, phospho-myosin (red) and nuclei (blue). (C) Lines describing the apical surface curvature of lens pits from embryos of the indicated genotypes. The lines represent average curvature of lens pits from five embryos, compiled using coordinate geometry. (D) Examples of phospho-MRLC labeling of cryosectioned lens pits from control and Trio-deficient mouse embryos. The yellow lines depict the axes of immunofluorescent quantification. (E) The average pixel intensity along apical-basal line intervals (depicted in D) in lens pit cells from control (gray line) or Trio-deficient (red line) embryos immunolabeled for phospho-MRLC. The means are calculated from ≥17 cells from at least four different lens pits. Statistical significant differences were evaluated by calculating P-values (see Materials and methods) for each pixel along the apical-basal axis. The blue line indicates the trend of statistical P-values subtracted from 1 and values greater than 0.95 (P<0.05) indicate regions in which a statistically significant difference in signal intensity is found. (F) The average cell shape for control and Trio-deficient lens pit cells was quantified. The numerical values above and below each shape indicate the fold difference compared with the average basal width of control cells.

