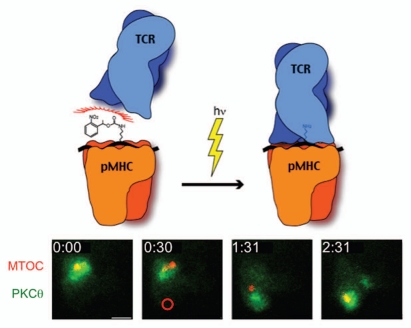
Figure 2.
Photoactivation of the TCR induces MTOC reorientation. Above, schematic diagram of the photoactivation strategy, which involves UV-induced cleavage of an NPE group attached to a central lysine in the MCC peptide. Below, a timelapse montage from a TCR photoactivation experiment showing a T cell expressing GFP-labeled PKCθ and RFP-labeled α-tubulin (to visualize the MTOC). Time (in min) is shown in the top left corner of each image. The region of UV irradiation, which was applied at the 30 s timepoint, is indicated by a red circle. Scale bar = 5 µm.

