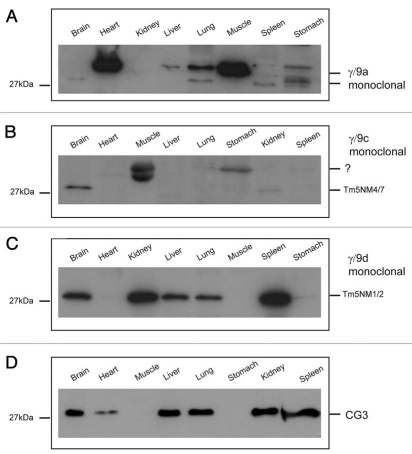
Figure 14.
Expression profile of Tm isoforms coded by the TPM3 gene in a panel of mouse tissues. Equal loading (20 µg) of total cellular protein isolated from different mouse tissues was electrophoresed on 12.5% SDS gels and individual protein gel blots probed with the (A) γ/9a, (B) γ/9c, (C) γ/9d and (D) CG3 antibodies.

