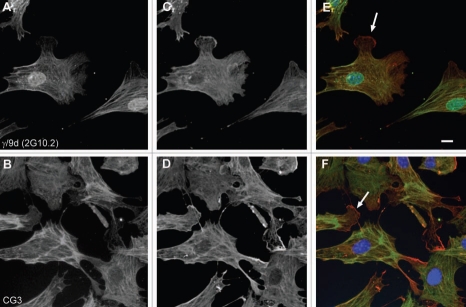
Figure 17.
Immunofluorescence staining of mouse primary embryonic fibroblasts with antibodies directed to Tm isoforms coded by the TPM3 gene. (A and B) Tms in green, (C and D) γactin in red and (E and F) merge images. Nuclei were visualized with DAPI. Arrows in (E and F) denote the cell periphery. Bar = 10 µm.

