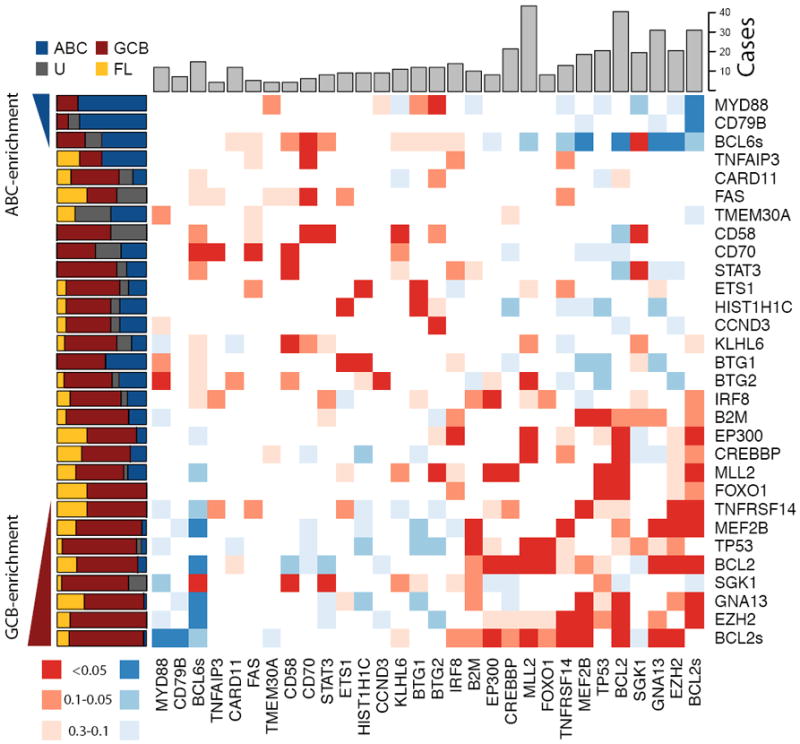
Figure 2. Overview of mutations and potential cooperative interactions in NHL.

This heat map displays possible trends towards co-occurrence (red) and mutual exclusion (blue) of somatic mutations and structural rearrangements. Colours were assigned by taking the minimum value of a left- and right-tailed Fisher exact test. To capture trends a P-value threshold of 0.3 was used, with the darkest shade of the colour indicating those meeting statistical significance (P <=0.05). The relative frequency of mutations in ABC (blue), GCB (red), unclassifiable (black) DLBCLs and FL (yellow) cases is shown on the left. Genes were arranged with those having significant (P<0.05, Fisher exact test) enrichment for mutations in ABC cases (blue triangle) towards the top (and left) and those with significant enrichment for mutations in GCB cases (red triangle) towards the bottom (and right). The total number of cases in which each gene contained either cSNVs or confirmed somatic mutations is shown at the top. The cluster of blue squares (upper-right) results from the mutual exclusion of the ABC-enriched mutations (e.g. MYD88, CD79B) from the GCB-enriched mutations (e.g. EZH2, GNA13). Presence of structural rearrangements involving the two oncogenes BCL6 and BCL2 (indicated as BCL6s and BCL2s) was determined with FISH techniques utilizing break-apart probes (Methods).
