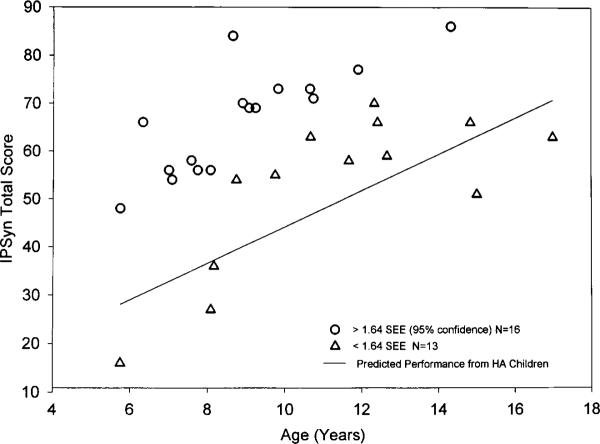
Figure 4.
Total IPSyn scores obtained by children with cochlear implants as a function of chronological age. The solid line represents the obtained regression of age onto IPSyn performance obtained with the children using hearing aids represented in Figure 3. The circles represent scores that exceed the 95% prediction interval based on standard error of estimate (SEE) for the child's age. Triangles represent scores falling inside the 95% prediction interval.

