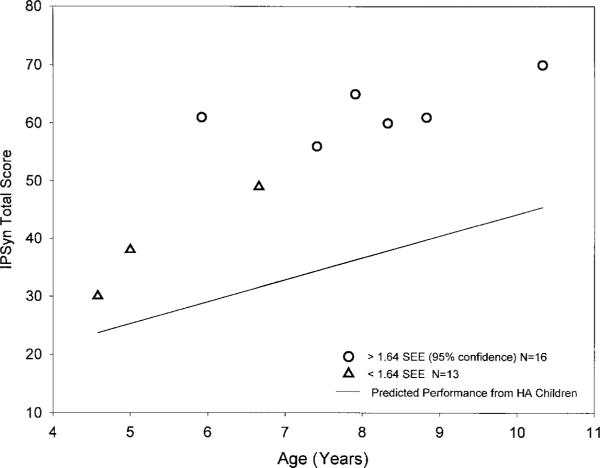
Figure 5.
Total IPSyn score obtained on the first examination by 9 children using cochlear implants. The circles represent scores that exceed the 95% prediction interval based on the standard error of estimate (SEE) for the child's age. Triangles represent scores falling inside the 95% prediction interval.

