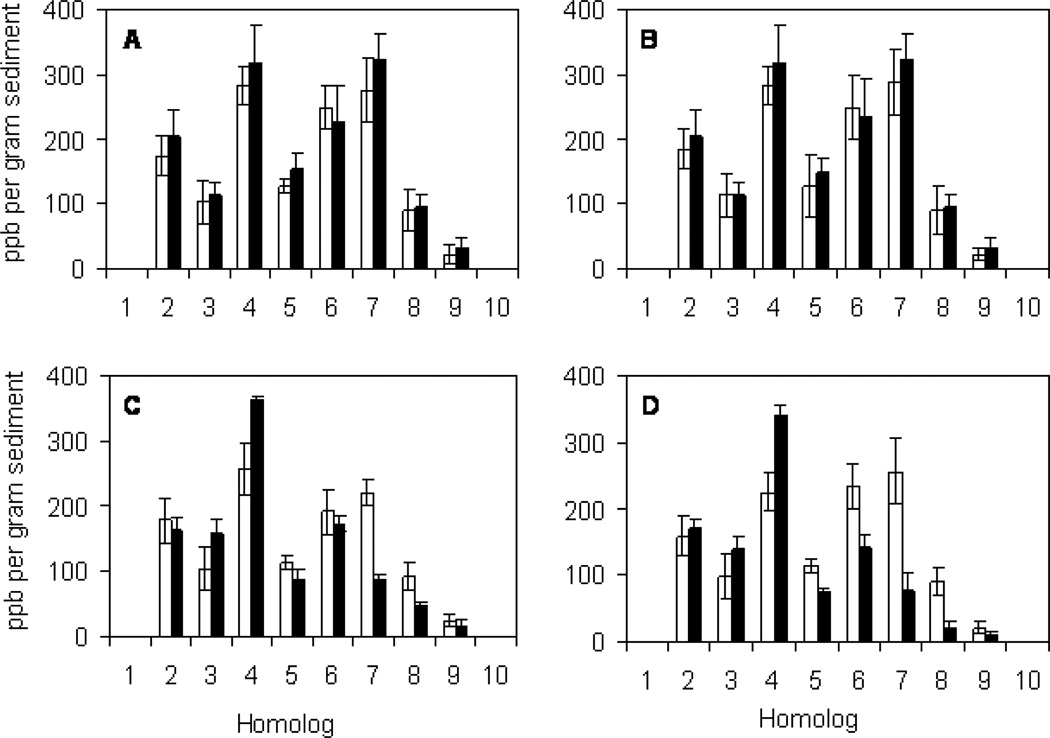
Figure 1.
PCB analysis by homolog at day 0 (white bars) and day 120 (black bars) after treatment with filter sterilized spent growth medium (A), sterilized spent growth medium and GAC (B), concentrated DF1 in growth medium inoculated directly into the sediment (C) and concentrated DF1 adsorbed onto GAC (D). Each bar represents the mean and standard deviation of three replicates samples.

