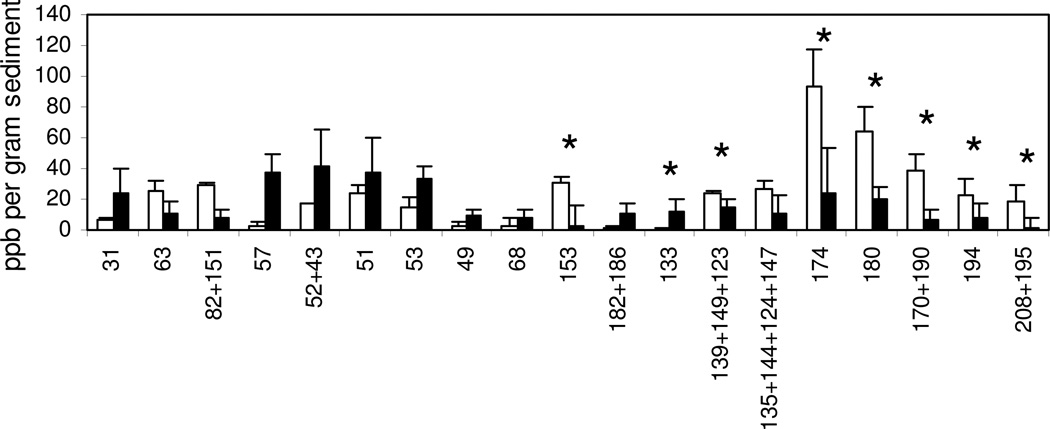
Figure 3.
Congeners showing greatest change in mesocosms receiving both GAC and DF1 at day 0 (□) and day 120 (■). An asterisk (*) indicates congeners that could be dechlorination substrates of DF1, or products from double flanked dechlorination by DF-1. Each bar represents the mean and standard deviation of three replicates samples.

