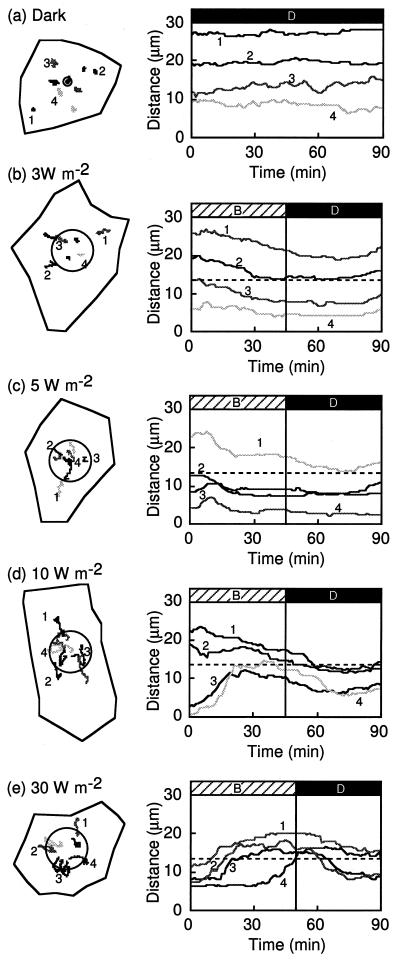
Figure 4.
Blue-light-induced chloroplast relocation in light-adapted prothallial cells. On the left are tracks of chloroplast movements in the cells (shown as closed lines) during the experimental treatment. Circles show the irradiated areas of the cells. On the right are graphs of the changes in distance between the center of the irradiated area and the chloroplasts with time. The line numbers in the right panels correspond to the chloroplast numbers shown in the left panels. a, Dark control immediately after transferring from light to the dark. A light-grown prothallial cell was observed in the dark under IR light. A symbol (⊙) shows the designated center of irradiation. b through e, Light-grown prothallial cells irradiated with blue light of 3, 5, 10, or 30 W m−2 for 45 or 50 min, respectively, and then kept in the dark. Each line is separated by a 1-min interval. The cell in e is the same one shown in Figure 3. Other details are the same as for Figure 2.

