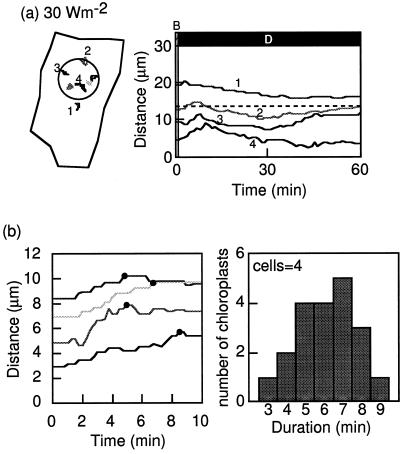
Figure 7.
Chloroplast-avoidance response induced by a brief blue-light irradiation in light-adapted prothallial cells. a, Light-adapted prothallial cell irradiated with blue light of 30 W m−2 for 1 min. On the left are tracks of chloroplast movements in the cell (shown as closed lines) during the experimental treatment. The circle shows the irradiated area of the cell. On the right is a graph of the changes in distance between the center of the irradiated area and the chloroplasts with time. The line numbers in the right panel correspond to the chloroplast numbers shown in the left panel. The cell is the same one shown in Figure 6. b, Examples of the time courses measured as the distance changes between the chloroplast and the center of the beam spot (left), and a histogram of duration of the avoidance response (right). The duration was estimated from the time course of chloroplast movement obtained at 15-s intervals as a period between the onset of blue-light irradiation. Black circles indicate when chloroplasts began to move back. Average of this histogram is 6.2 ± 0.4 min (mean ± se). Other details are the same as for Figure 2.

