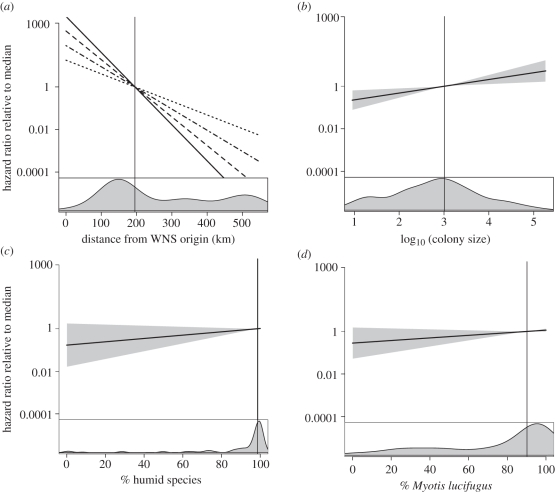
Figure 2.
Hazard ratios over the observed range of covariate values relative to the median (vertical lines) for, (a) distance from the origin of WNS in the northeastern US for winter years 2007–2010. Solid line, 2007; dashed line, 2008; dashed-dotted line, 2009; dotted line, 2010. (b) Colony size, (c) % humid species and (d) % Myotis lucifugus. Shading indicates 95% confidence intervals. See table 2 for distance to origin confidence intervals. Bottom panels are kernel density plots of covariate distributions.

