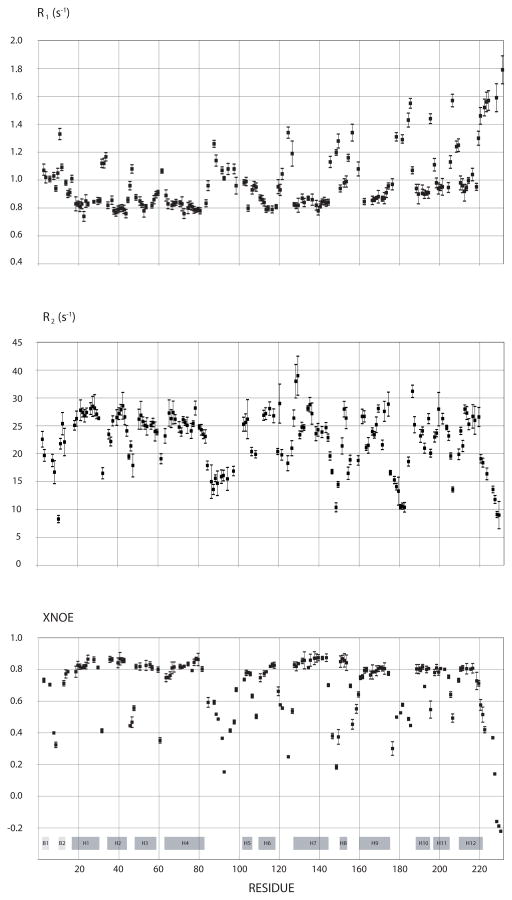
Figure 5.
15N- longitudinal (R1) and transverse (R2) relaxation rates and NOEs for the W184A/M185A-CA measured at 600 MHz. A total of 158 peaks without overlap were selected from the 2D-NMR spectra, and their relaxation data were fitted to single exponentials. The locations of the secondary structures are identified at the bottom, with B standing for beta strand and H for helices. Helix-8 refers to the short 310 helix. The flexible interdomain linker is located between H7 and H8. Residues 220 and 221 in helix-12 exhibited biexponential behavior and as a result show larger error bars when fitted to a single exponential. The error bars in R1 and R2 refer to the deviations of data points with the single exponential fitted curve. For the NOEs, the error bars refer to the noise in the spectrum.

