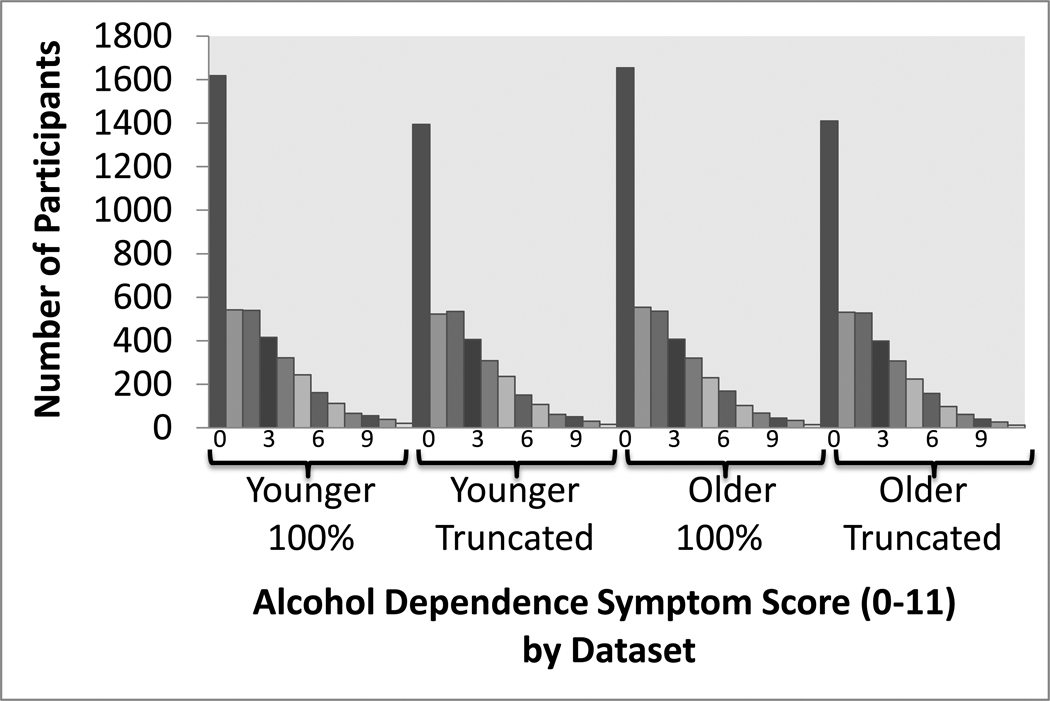
Fig. 1.
Distributions of alcohol dependence symptom scores (derived from 9 symptoms with a maximum score of 11) are shown for full (100%) and truncated samples and for datasets that differ for a subset of 803 individuals for whom data were collected on two occasions (1st occasion data (M = 1.8 ± 2.2) were included in the Younger dataset and 2nd occasion data M = 2.2 ± 2.6) in the Older dataset).

