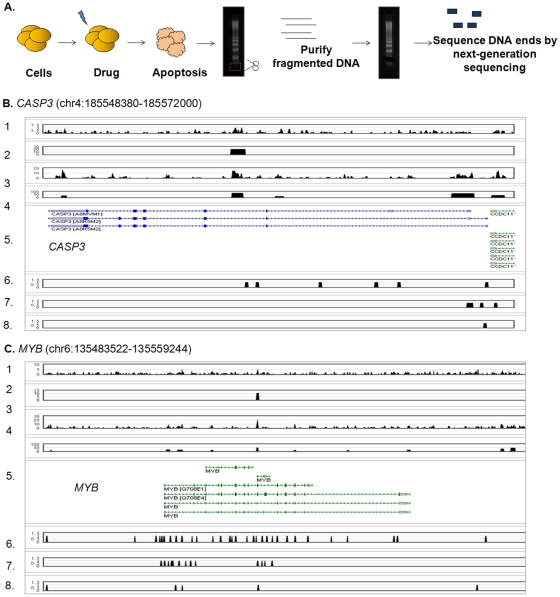
Figure 1. The Apoptoseq Method.
A. Schematic of the Apoptoseq methodology is shown. B. Screenshot of the apoptotic DNA patterns for the CASP3 gene Track labels: 1 – AHH001 biological replicate 1 Apoptoseq sequence density. 2 – Peaks called from AHH001. 3 - AHH002 biological replicate 2 Apoptoseq sequence density. 4 – Peaks called from AHH002. 5 – UCSC Genes. 6 – DNase I hypersensitivity Sequencing Peaks (1 indicates a peak is present, 0 indicates no peak is present) [53]. 7 – H3K4me3 ChIP-Seq Peaks (1 indicates a peak is present, 0 indicates no peak is present) [53]. 8 – CTCF ChIP-Seq Peaks (1 indicates a peak is present, 0 indicates no peak is present) [53]. C. Screenshot of the apoptotic DNA patterns for the MYB gene. Track labels follow labels in Figure 1B.

