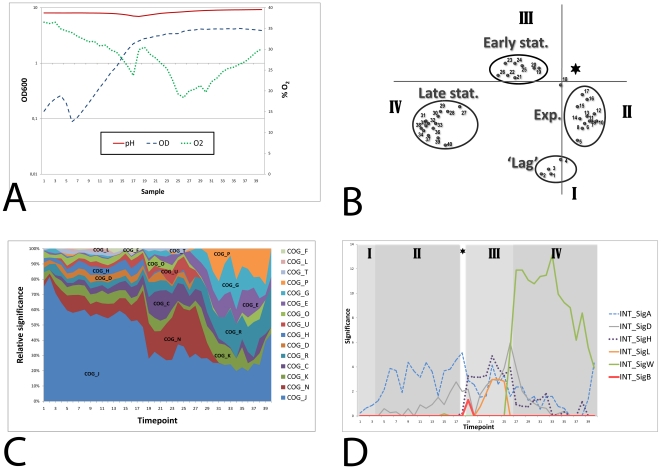
Figure 1. Growth curve and general characterization of the time-series experiment.
A) Optical density (OD600), pH and oxygen levels (% O2) of the culture were monitored. B) Visualization of the first two components from the PCA analysis. I: lag phase, II: exponential growth phase, III: early stationary phase, IV: late stationary phase. The asterisk represents the transition point. C) Significantly overrepresented COG classes (log transformed p-values (á = 0.05 and Bonferroni corrected)) scaled per time point. COG_J: Translation, ribosomal structure and biogenesis, COG_K: Transcription, COG_L: DNA replication, recombination and repair, COG_D: Cell division and chromosome partitioning, COG_O: Posttranslational modification, protein turnover, chaperones, COG_N: Cell motility and secretion, COG_P: Inorganic ion transport and metabolism, COG_T: Signal transduction mechanisms, COG_C: Energy production and conversion, COG_G: Carbohydrate transport and metabolism, COG_E: Amino acid transport and metabolism, COG_F: Nucleotide transport and metabolism, COG_H: Coenzyme metabolism, COG_U: Intracellular trafficking and secretion, COG_R: General function prediction only. D) Significantly overrepresented sigma factor regulons (log transformed p-values (á = 0.05 and Bonferroni corrected)). The different growth-phases that were identified by the PCA analysis are visualized in the expression graph. I: lag phase, II: exponential growth phase, III: early stationary growth phase. IV: late stationary growth phase. The asterisk represents the transition point.

