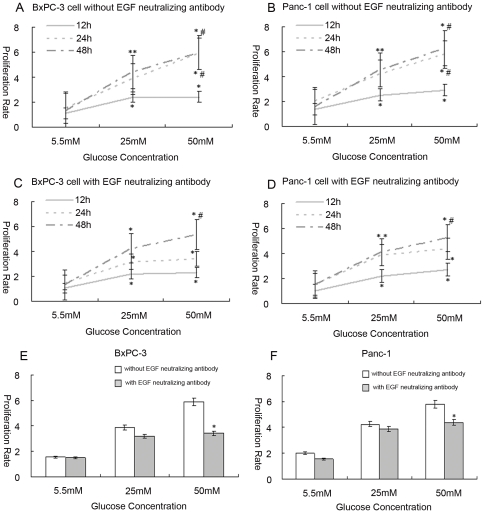
Figure 1. The influence of high glucose on cell proliferation.
Cells were exposed to medium with glucose concentrations varying from 5.5 to 50 mM for 12, 24, or 48 h. MTT assay was analyzed for proliferation rates (5.5 mM as a control). (A, B) shows the proliferation rates corresponding to different glucose concentrations in BxPC-3 and Panc-1 cells. (C, D) shows the proliferation rates corresponding to different glucose concentrations in BxPC-3 and Panc-1 cells treated with EGF-neutralizing antibody (* p<0.05 compared with group in 5.5 mM glucose; # p<0.05 compared with group in 25 mM glucose; n = 8 per group). (E, F) shows the comparison of proliferation rates before and after treating with EGF-neutralizing antibody with the different glucose concentrations in BxPC-3 and Panc-1 cells at the time point of 24 h (* p<0.05 compared with group of without EGF neutralizing antibody).

