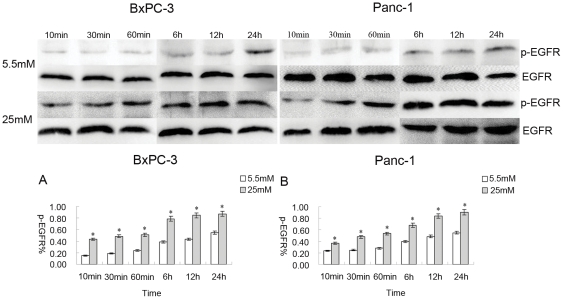
Figure 4. The transactivation of EGFR induced by high glucose.
EGF-neutralizing antibody (1 µg/ml) was added to cells before high glucose treatment. The data for p-EGFR % are derived from the ratio of p-EGFR and EGFR. The differences in phosphorylation levels were distinct between 5.5 mM and 25 mM glucose. The phosphorylation level in response to 25 mM glucose increased rapidly in BxPC-3 and Panc-1 cells (Fig. 4). The phosphorylation level in response to 5.5 mM glucose concentration was almost undetectable (10 min, 30 min, and 60 min); it did increase slowly, but it was faint, in BxPC-3 and Panc-1 cells (Fig. 4A and 4B).

