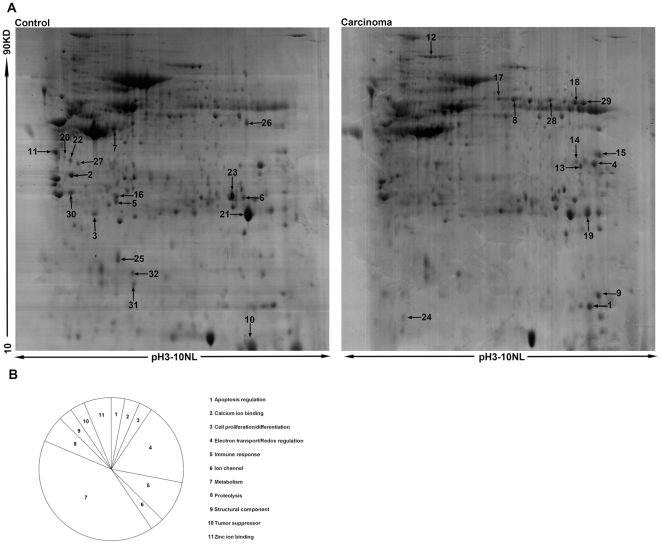
Figure 1. Protein profiles between lung adenocarcinoma tissues and corresponding normal lung tissues.
(A). Representative 2-DE maps of lung adenocarcinoma and normal tissues, with 2 mg protein loading amount and visualized by Coomassie blue staining. Arrows indicate identified protein spots significantly and consistently altered between carcinoma tissue and control normal tissues. (B). Cluster analysis, the altered proteins were involved in diverse biological processes, including metabolism (40.6%), electron transport/redox regulation (18.8%), immune response (9.4%), proteolysis (6.3%), and so on.

