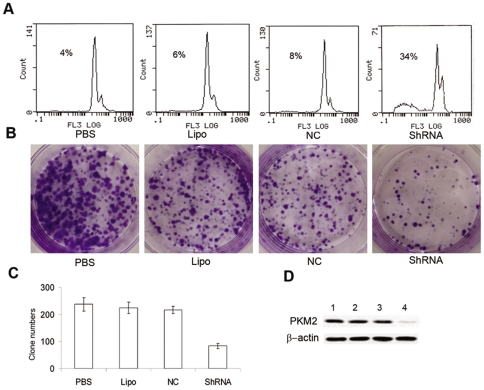
Figure 4. Suppression of PKM2 showed significantly antitumor effects.
(A). Flow cytometry assay. SPC-A1 cells treated with PKM2-ShRNA plasmids for 48 h have a significantly sub-G1 peak compared with control groups. (B). Colony formation assay. Following transfection, SPC-A1 cells were allowed to grow for additional 14 days. The colonies were then fixed with methanol and stained with Crystal Violet. (C). Clonogenic formation assay showed that the clone numbers were 237±24.78, 224±21.61, 216±14.09, and 83±9.43 in PBS group, Lipo group, NC group, and PKM2-ShRNA treated group, respectively. Inhibition ratio of PKM2-ShRNA group was 64.9% compared with PBS group (Dunnett-t test, P<0.01). (D). Expression of PKM2 in SPC-A1 was significantly down-regulated by PKM2-ShRNA plasmids. (1) PBS group; (2) Lipo group; (3) NC group; (4) PKM2-ShRNA group.

