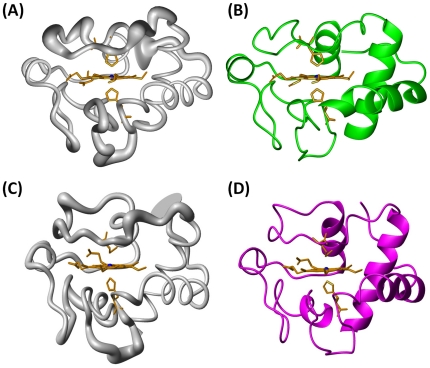
Figure 5. 3D solution structures of cyt c P71H variant in oxidized and reduced states.
(A) Backbone of the family of 20 oxidized P71H structures shown as a tube of variable radius. The radius is proportional to the RMSD of each residue. (B) Ribbon diagram representation of the oxidized P71H mutant. (C) Backbone of the family of 20 reduced P71H structures shown as a tube of variable radius. (D) Ribbon diagram representation of the reduced P71H mutant. The figures are generated with the program MOLMOL. The iron ion was represented as ball.

