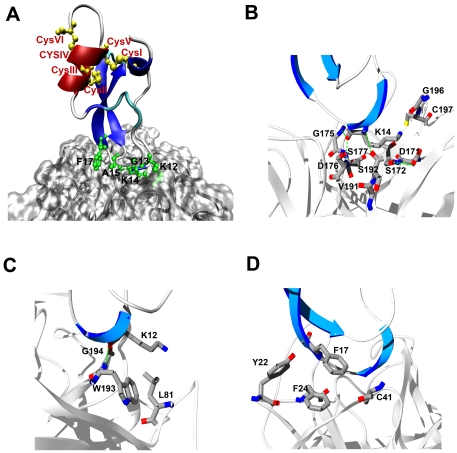
Figure 9. SdPI-trypsin complex predicted by molecular dynamics simulation.
(A) The α-helix and β-strands of the modeled SdPI structure are displayed in red and blue, respectively. Disulfide bonds are shown in yellow. The active site residues of SdPI are represented as green sticks. (B) Lys14, the P1 residue of SdPI, can fit into the S1 pocket of trypsin. (C) The adjacent residue Lys12 likely also contributes to enhancing the SdPI-trypsin interactions. (D) The nearby residue Phe17 may also contribute to enhancing the SdPI-trypsin interaction.

