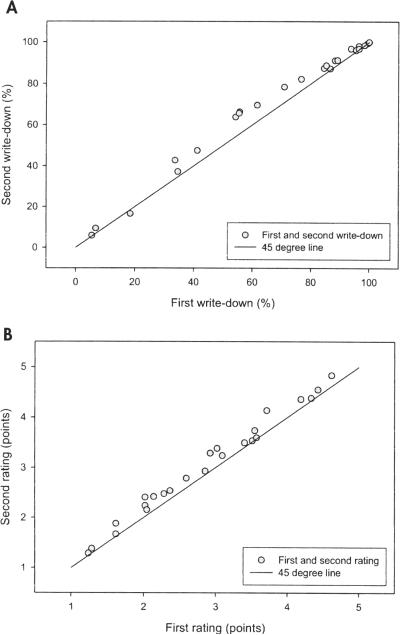
Figure 1.
Shown in Panels A and B are the scatter plots of the write-down and rating-scale intelligibility scores obtained from the first and second listening conditions, respectively. The first intelligibility scores are depicted on the x-axis, and the second intelligibility scores are represented on the y-axis. A 45° line is shown in each panel.

