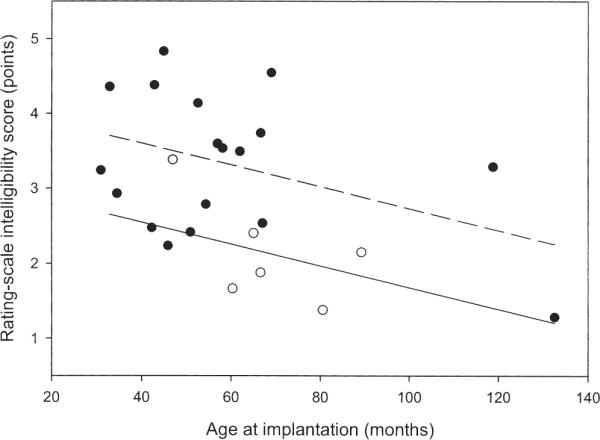
Figure 4.

The rating-scale intelligibility scores are shown as a function of age at implantation for the 24 CI recipients. The filled and open circles represent the scores of the CI participants in the SPEAK (n = 18) and the MPEAK (n = 6) groups, respectively. Fitted regression lines for the SPEAK and MPEAK groups are shown with the dashed and straight lines, respectively.
