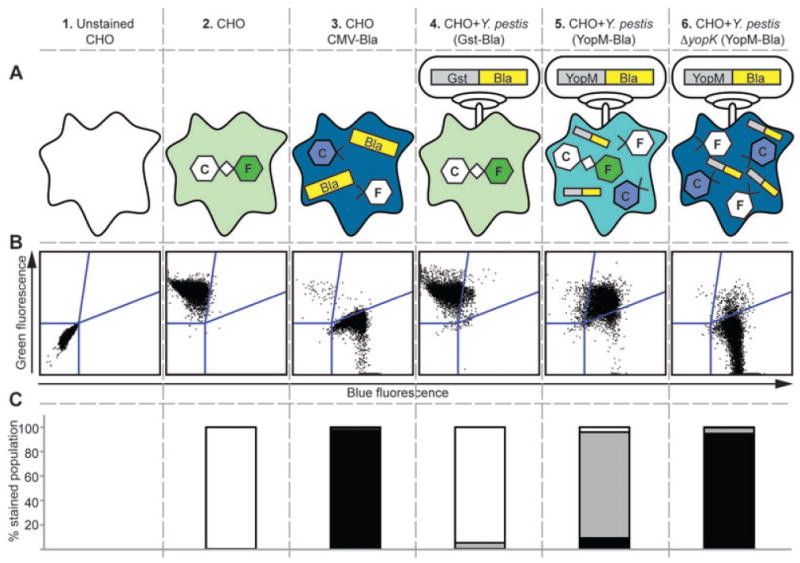
Fig. 1.

Schematic of quantitative Bla reporter assay. (A) shows the nature of the cell populations being analysed. (B) displays raw flow cytometry data. In (C), the flow cytometry data are quantified in stacked bar graph format. Columns 1–3 show uninfected samples used to establish both compensation settings and gates for flow cytometry. Unstained CHO cells determine the population negative for fluorescence. The rest of the samples have been incubated with CCF2-AM, a compound fluorophore composed of Coumarin (C) and Fluorescein (F) groups connected via a β-lactam ring. A CHO cell line that constitutively expresses Bla (CHO CMV-Bla) is used to create a gate for cells with only blue fluorescence (column 3). The gate between green and blue (upper right quadrant) is for cells with low-level injection that have incomplete cleavage of CCF2-AM and exhibit both blue and green fluorescence, referred to as aqua. Columns 4–6 show CHO cells infected with WT or ΔyopK Y. pestis expressing the Gst-Bla control or the YopM-Bla reporter. The flow cytometry data are shown in stacked bar graph format as % stained population, referring to the percentage of cells within the population of stained cells that exhibit either green (white bars), aqua (grey bars) or blue (black bars) fluorescence.
