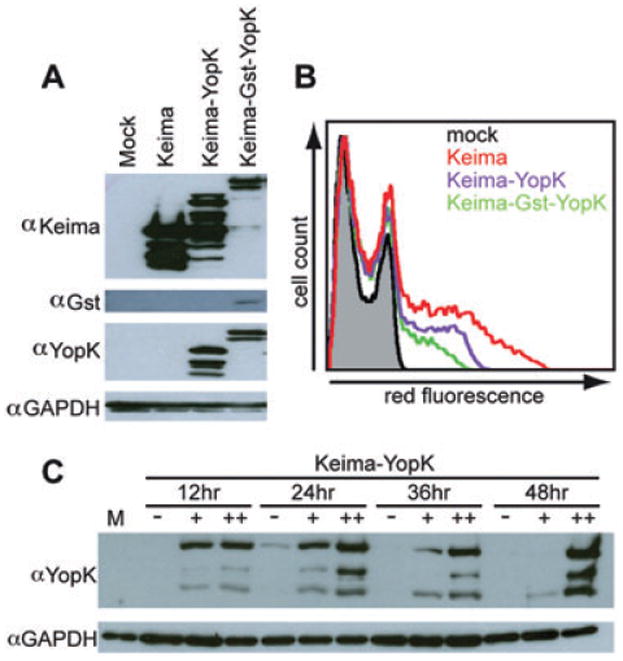
Fig. 5.

Characterization of eukaryotic YopK expression vectors. A. CHO cells transfected for 24 h were lysed, subjected to SDS-PAGE and Western blotted with antibody raised against YopK, Keima, Gst and p130cas as a loading control. B. Twenty-four-hour transfected CHO cells were suspended and analysed via flow cytometry for red fluorescence. The histogram shows the traces of a negative mock-transfected population (black), cells carrying the empty vector expressing Keima (red), cells expressing Keima–YopK (purple) and cells expressing Keima–Gst–YopK (green). C. CHO cells transfected for times ranging from 12 to 48 h were divided into populations with no (−), low (+) or high (++) red fluorescence using FACS. Each sample was lysed, subjected to SDS-PAGE and Western blotted to visualize YopK and loading control GAPDH.
