
Figure 3.
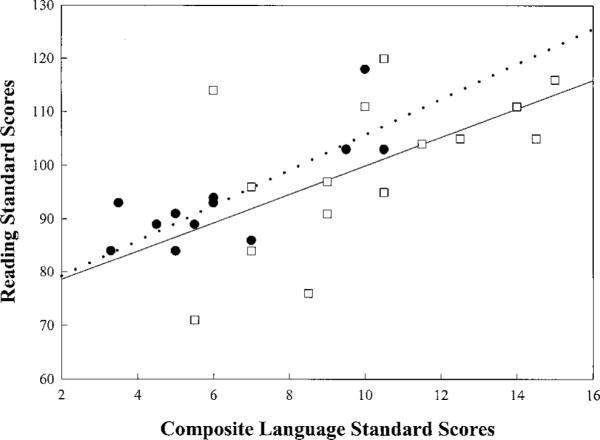
This figure illustrates the relationship between reading standard scores and composite language standard scores for the cochlear implant and normal-hearing groups. The solid circles represent the scores from the cochlear implant group, and the squares represent the scores from the normal-hearing group. The regression line for the cochlear implant group is represented by the dotted line (r = .80, p = .001), and the regression line for the normal-hearing group is represented by the solid line (r = .52, p = .02).