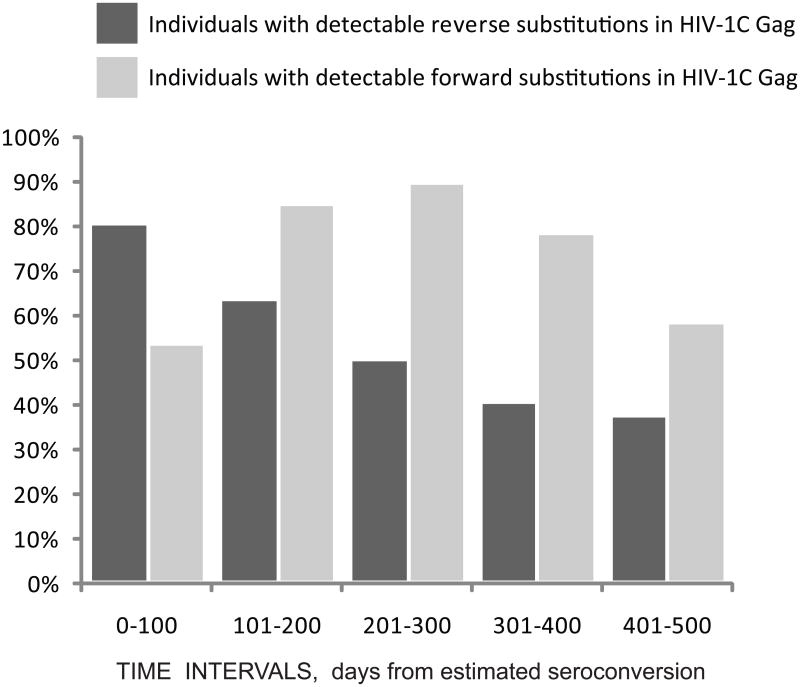
Figure 5.
Proportion of individuals with detectable amino acid substitutions in Gag over time. Individuals with detectable reverse substitutions are shown by dark bars. Individuals with detectable forward substitutions are shown by light bars. Analyzed time intervals in days from estimated seroconversion are shown at the bottom.

