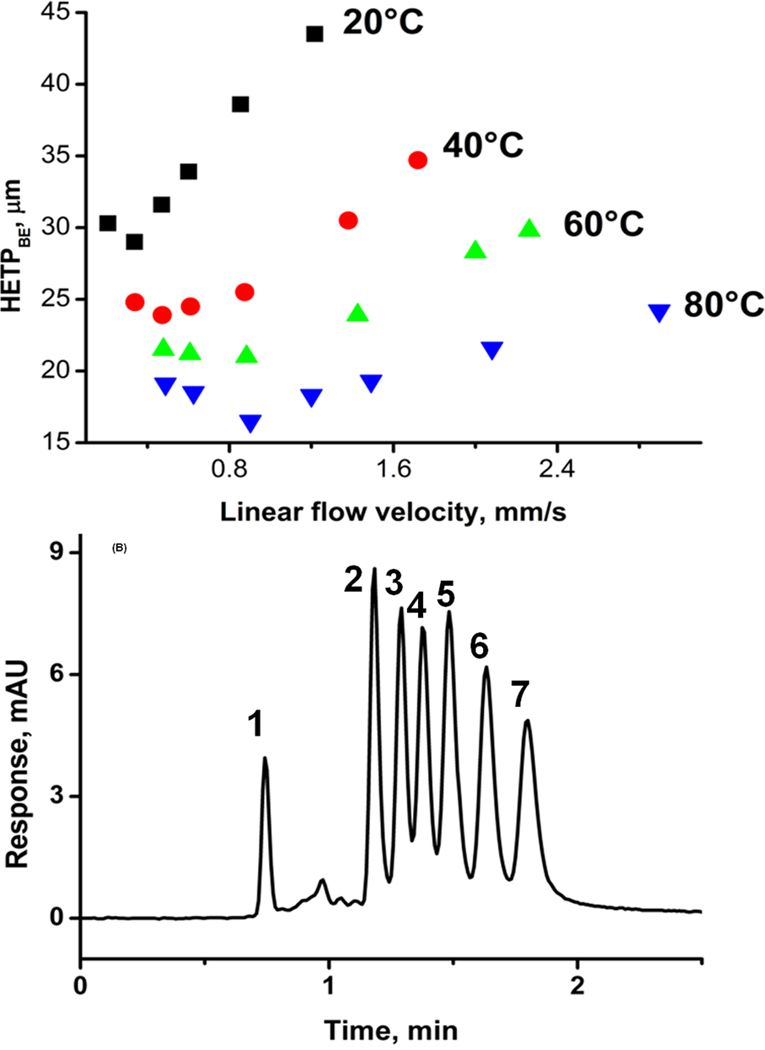
Fig. 17.
Effect of temperature on van Deemter plots for benzene (A) and separation of small molecules (B) using hypercrosslinked monolithic column Conditions: column 130 mm × 100 µm I.D., ternary mobile phase 20% water, 20% tetrahydrofuran, 60% acetonitrile, (B) flow rate 0.5 µL/min; temperature 80°C; UV detection 254 nm; back pressure 26 MPa. Analytes: (1) uracil, (2) benzene, (3) toluene, (4) ethylbenzene, (5) propylbenzene, (6) butylbenzene, (7) pentylbenzene. Adapted from ref. [64].

