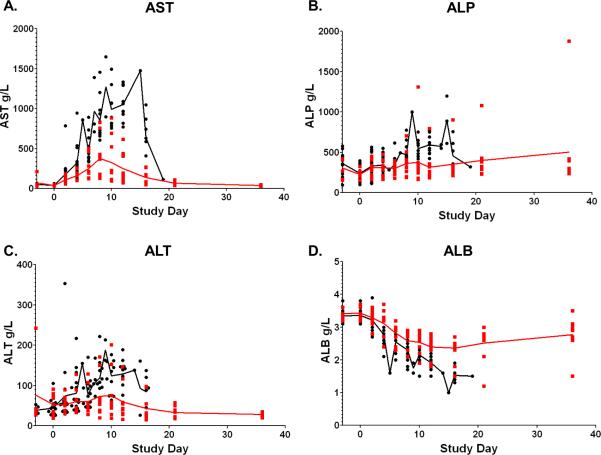
Figure 2.
Serum chemistry values associated with lethality. Longitudinal analysis of the daily averages from time of inoculation to study end. Data points represent individual NHPs, the red line represents the daily average of survivors; the black line represents the daily average of the non-survivors.

