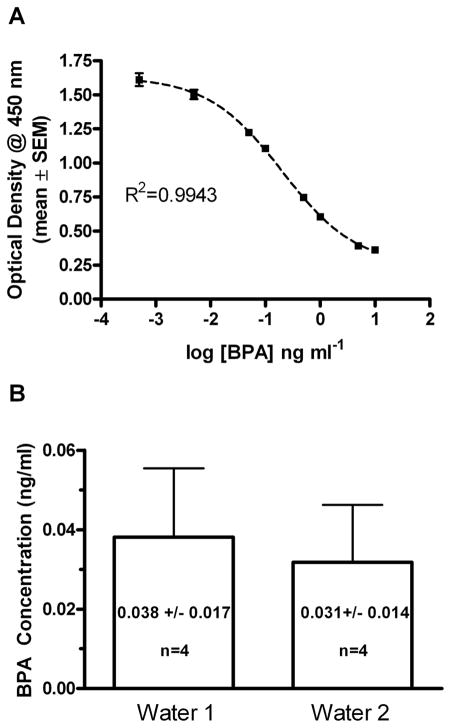
Figure 1. Bisphenol A (BPA) ELISA standard curve and analysis of control water samples.
(A) The standard curve resulting from a non-linear sigmoidal curve fit of the BPA standard from a representative experiment is shown graphically. Data points are mean optical density values ± SEM at each known concentration.(B) The concentrations of BPA-like immunoreactivity present in samples of HPLC water used in this study were estimated using the BPA ELISA assay. For each experiment the concentration of BPA was determined in each of 4 samples. The mean values ± SD are indicated and in each experiment concentrations found were below the established detection limit of 0.05 ng ml−1 for the assay. The mean calculated BPA concentration for each experimental determination is indicated in each bar.

