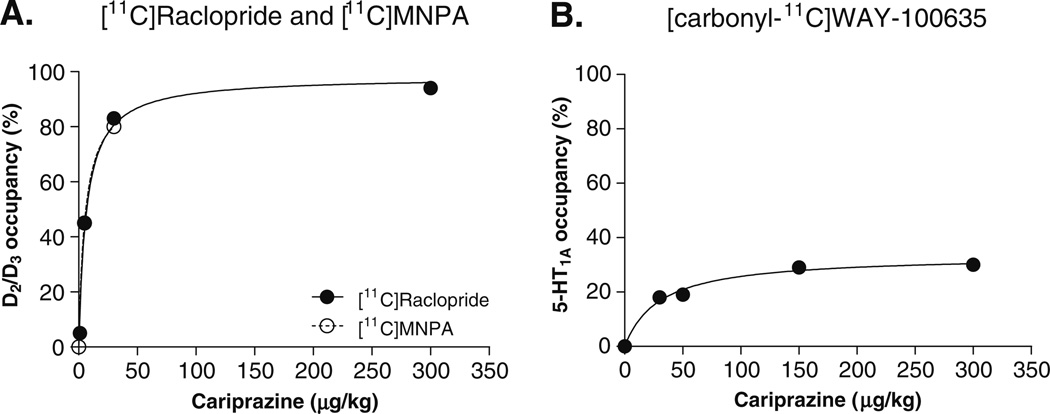
Fig. 3.
A hyperbolic curve fit of dopamine D2/D3 (a) ([11C]raclopride (filled circle) and [11C]MNPA (empty circle)) and (b) serotonin 5-HT1A ([carbonyl-11C]WAY-100635 (filled circle)) receptor occupancy plotted as a function of cariprazine dose (µg/kg). Receptor occupancy reflects the percent change in BPND estimated by MRTM2 under the post-dose drug treatment condition compared with baseline measurements

