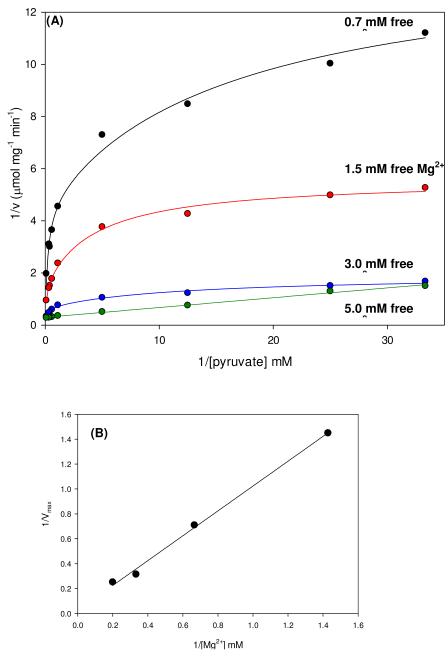
Figure 1.
(A) Nonlinear double reciprocal plots obtained when the initial rates of pyruvate carboxylation were determined at varying concentrations of pyruvate (0.03-10 mM) and fixed concentrations of free Mg2+ (0.7 mM, black; 1.5 mM, red; 3.0 mM, blue; 5.0 mM, green). Solid lines are the calculated individual fits of the data to eqn (3) for Mg2+ concentrations up to 3.0 mM and to eqn (1) for 5.0 mM Mg2+. (B) Replot of Vmax vs. 1/[Mg2+].

