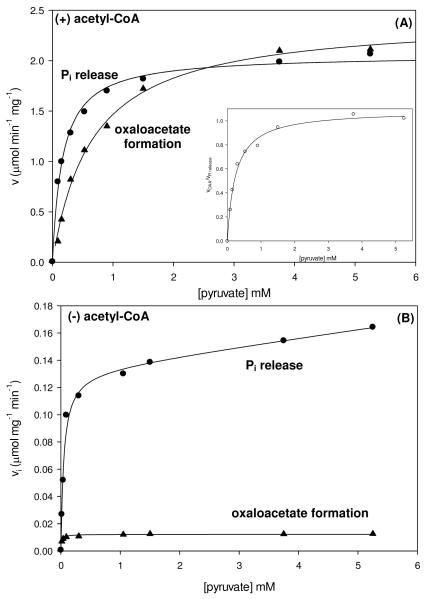
Figure 4.
Initial rates of Pi release (●) and oxaloacetate formation (▲) at varying concentrations of pyruvate (0.03-5.25 mM) were determined to evaluate the extent of coupling between the HCO3−-ATP cleavage and pyruvate carboxylation reactions in the presence (A) and absence (B) of saturating concentrations of acetyl-CoA. Solid lines indicate the least-square fits to eqn (1). Inset: Ratio of the rates of oxaloacetate formation and Pi release (○) as a function of pyruvate concentrations. Solid lines indicate the least-square fits to eqn (1).

