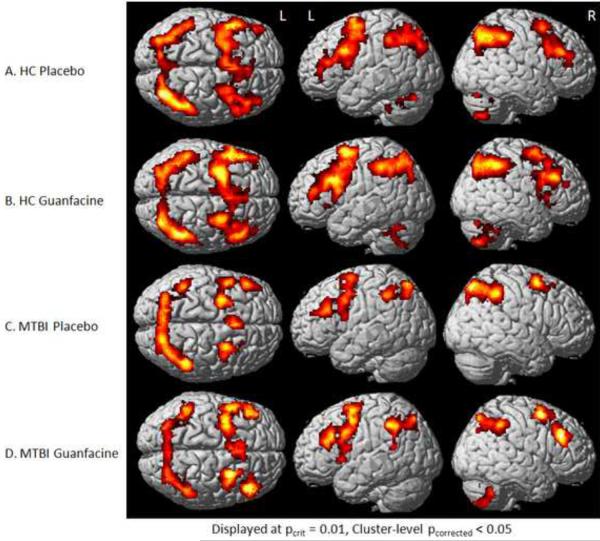
Figure 1.
Group Activation Patterns during 2-Back in Response to Pharmacological Challenge
Activation maps (SPM5) for each group (MTBI and HC) under each drug condition (placebo or guanfacine). Note increased right frontal activation in the MTBI group on guanfacine when compared to placebo (1C and 1D).

